
The items we have looked at so far allowed us to query the built-in capabilities of a Zabbix agent, query SNMP devices, and reuse data on the Zabbix server. Every now and then, a need arises to monitor something that is not supported by Zabbix out of the box. The easiest and most popular method to extend Zabbix data collection is user parameters. They are commands that are run by the Zabbix agent and the result is returned as an item value. Let's try to set up some user parameters and see what things we should pay extra attention to.
First, we'll make sure that we can get the agent to return any value at all. User parameters are configured on the agent side—the agent daemon contains the key specification, which includes references to commands. On "A test host", edit zabbix_agentd.conf and look near the end of the file. An explanation of the syntax is available here:
UserParameter=<key>,<shell command>
This means that we can freely choose the key name and command to be executed. It is suggested that you keep key names to lowercase alphanumeric characters and dots. For starters, add a very simple line like this:
UserParameter=quick.test,echo 1
Just return 1, always. Save the configuration file and restart the Zabbix agent daemon. While it might be tempting to add an item like this in the frontend, it is highly recommended to test all user parameters before configuring them in the frontend. That will provide the results faster and overall make your life simpler. The easiest way to test an item is with zabbix_get—we discussed this small utility in Chapter 3, Monitoring with Zabbix Agents and Basic Protocols. Run on "A test host":
$ zabbix_get -s 127.0.0.1 -k quick.test
That should return just "1". If it does, great—your first user parameter is working. If not, well, there's not much that could go wrong. Make sure the correct file was being edited and the agent daemon was really restarted. And that the correct host was queried.
We won't actually add this item in the frontend as it won't provide much value. Instead, let's re-implement an item that is already available in the Zabbix agent—counting the number of logged-in users. Edit zabbix_agentd.conf again and add the following near our previous modification:
UserParameter=system.test,who | wc -l
Notice how we can chain multiple commands. In general, anything the underlying shell would accept would be good. Save the file and restart the Zabbix agent daemon. Now to the quick test again:
$ zabbix_get -s 127.0.0.1 -k system.test
That should return a number—as you are probably running zabbix_get from the same system, it should be at least 1. Let's create an item to receive this data in the frontend. Open Configuration | Hosts, make sure Linux servers is selected in the Group dropdown and click on Items next to A test host, then click on Create item. Fill in these values:
- Name:
Users logged in - Type: Zabbix agent (active)
- Key:
system.test
We are using the active item type with our user parameter. User parameters are suggested to be used as active items as they can tie up server connections if they do not return very quickly. Notice how we used exactly the same key name as specified in the agent daemon configuration file. When you are done, click on Add.
Now check Monitoring | Latest data. As this is an active item, we might have to wait for the agent to request the item list from the server, then return the data, which can take up to 2 minutes in addition to the server updating its cache in 1 minute. Sooner or later, the data will appear.
The great thing is that it is all completely transparent from the server side—the item looks and works as if it was built in.
We have gotten a basic user parameter to work, but this one replicates the existing Zabbix agent item, thus it still isn't that useful. The biggest benefit provided by user parameters is the ability to monitor virtually anything, even things that are not natively supported by the Zabbix agent, so let's try some slightly more advanced metrics.
One thing we might be interested in is the number of open TCP connections. We can get this data using the netstat command. Execute the following on the Zabbix server:
$ netstat -t
The -t switch tells netstat to list TCP connections only. As a result, we get a list of connections (trimmed here):
Active Internet connections (w/o servers)
Proto Recv-Q Send-Q Local Address           Foreign Address         State
tcp        0      0 localhost:zabbix-trapper localhost:52932         TIME_WAIT
tcp        0      0 localhost:zabbix-agent  localhost:59779         TIME_WAIT
tcp        0      0 localhost:zabbix-agent  localhost:59792         TIME_WAIT
To get the number of connections, we'll use the following command:
netstat -nt | grep -c ^tcp
Here, grep first filters out connection lines and then just counts them. We could have used many other approaches, but this one is simple enough. Additionally, the -n flag is passed to netstat, which instructs it to perform no resolving on hosts, thus giving a performance boost.
Edit zabbix_agentd.conf and add the following line near the other user parameters:
UserParameter=net.tcp.conn,netstat -nt | grep -c ^tcp
In the frontend, go to Configuration | Hosts, click on Items next to A test host, then click on Create item and fill in the following values:
- Name:
Open connections - Type: Zabbix agent (active)
- Key:
net.tcp.conn
When you are done, click on the Add button at the bottom. Did you notice that we did not restart the agent daemon after modifying its configuration file? Do that now. Using such an ordering of events will give us values faster, because the agent queries the active items list immediately after startup, and this way the server already has the item configured when the agent is restarted. Feel free to check Monitoring | Latest values:
We are now gathering data on all open connections. But looking at the netstat output, we can see connections in different states, such as TIME_WAIT and ESTABLISHED:
tcp        0      0 127.0.0.1:10050         127.0.0.1:60774         TIME_WAIT
tcp        0      0 192.168.56.10:22        192.168.56.1:51187      ESTABLISHED
If we want to monitor connections in different states, would we have to create a new user parameter for each? Fortunately, no. Zabbix supports the so-called flexible user parameters, which allow us to pass parameters to the command executed.
Again, edit zabbix_agentd.conf and modify the user parameter line we added before to read as follows:
UserParameter=net.tcp.conn[*],netstat -nt | grep ^tcp | grep -c "$1"
We have made several changes here. First, the addition of [*] indicates that this user parameter itself accepts parameters. Second, adding the second grep statement allows us to use such passed parameters in the command. We also moved the -c flag to the last grep statement to do the counting.
All parameters we would use now for this key will be passed to the script—$1 substituted for the first parameter, $2 for the second, and so on. Note the use of double quotes around $1. This way, if no parameter is passed, the result would be the same as without using grep at all.
Restart the agent to make it pick up the modified user parameter.
Back in the frontend Configuration | Hosts, click on Items next to A test host, and click on Open connections in the NAME column, then click on the Clone button at the bottom of the editing form. Change the following fields:
- Name:
Open connections in $1 state - Key:
net.conn[TIME_WAIT]
Click on the Add button at the bottom. Now click on Open connections in the TIME_WAIT state in the NAME column, click on Clone and modify the Key field to read net.conn[ESTABLISHED], then click on the Add button at the bottom.
Take a look at Monitoring | Latest data:

It is possible that the values don't match—summing open connections in all states might not give the same number as all open connections. First, remember that there are more connection states, so you'd have to add them all to get a complete picture. Second, as we saw before, all of these values are not retrieved simultaneously, thus one item grabs data, and a moment later another comes in, but the data has already changed slightly.
We are now receiving values for various items, but we only had to add a single user parameter. Flexible user parameters allow us to return data based on many parameters. For example, we could provide additional functionality to our user parameter if we make a simple modification like this:
UserParameter=net.conn[*],netstat -nt | grep ^tcp | grep "$1" | grep -c "$2"
We added another grep command on the second parameter, again using double quotes to make sure the missing parameter won't break anything. Now we can use the IP address as a second parameter to figure out the number of connections in a specific state to a specific host. In this case, the item key might be net.conn[TIME_WAIT,127.0.0.1].
Note that the item parameter ordering (passing state first, IP second) in this case is completely arbitrary. We could swap them and get the same result, as we are just filtering the output by two strings with grep. If we were to swap them, the description would be slightly incorrect, as we are using positional item key parameter references in it.
There are almost unlimited combinations of what details one can monitor on some target. It is possible to monitor every single detailed parameter of a process, such as detailed memory usage, the existence of PID files, and many more things, and it is also possible to simply check whether a process is running.
Sometimes a single service can require multiple processes to be running, and it might be enough to monitor whether a certain category of processes is running as expected, trusting some other component to figure that out. One example could be Postfix, the e-mail server. Postfix runs several different processes, including master, pickup, anvil, smtpd, and others. While checks could be created against every individual process, often it would be enough to check whether the init script thinks that everything is fine.
We would need an init script that has the status command support. As init scripts usually output a textual strings Checking for service Postfix: running, it would be better to return only a numeric value to Zabbix that would indicate the service state. Common exit codes are "0" for success and nonzero if there is a problem. That means we could do something like the following:
/etc/init.d/postfix status > /dev/null 2>&1 || echo 1
That would call the init script, discard all stdin and stderr output (because we only want to return a single number to Zabbix), and return "1" upon a non-successful exit code. That should work, right? There's only one huge problem—parameters should never return an empty string, which is what would happen with such a check if Postfix was running. If the Zabbix server were to check such an item, it would assume the parameter is unsupported and deactivate it as a consequence. We could modify this string so that it becomes the following:
/etc/init.d/postfix status > /dev/null 2>&1 && echo 0 || echo 1
This would work very nicely, as now a Boolean is returned and Zabbix always gets valid data. But there's a possibly better way. As the exit code is 0 for success and nonzero for problems, we could simply return that. While this would mean that we won't get nice Boolean values only, we could still check for nonzero values in a trigger expression like this:
{hostname:item.last()}>0As an added benefit, we might get a more detailed return message if the init script returns a more detailed status with nonzero exit codes. As defined by the Linux Standard Base, the exit codes for the status commands are the following:
|
Code |
Meaning |
|---|---|
|
|
Program is running or service is OK |
|
|
Program is dead and |
|
|
Program is dead and |
|
|
Program is not running |
|
|
Program or service status is unknown |
There are several reserved ranges that might contain other codes, used by a specific application or distribution—those should be looked up in the corresponding documentation.
For such a case, our user parameter command becomes even simpler, with the full string being the following:
UserParameter=service.status[*],/etc/init.d/"$1" status > /dev/null 2>&1; echo $?
We are simply returning the exit code to Zabbix. To make the output more user friendly, we'd definitely want to use value mapping. That way, each return code would be accompanied on the frontend with an explanatory message like the above. Notice the use of $1. This way, we can create a single user parameter and use it for any service we desire. For an item like that, the appropriate key would be service.status[postfix] or service.status[nfs]. If such a check does not work for the non-root user, sudo would have to be used.
In open source land, multiple processes per single service are less common, but they are quite popular in proprietary software, in which case a trick like this greatly simplifies monitoring such services.
Let's try to find out what other interesting statistics we can gather this way. A common need is to monitor some statistics about databases. We could attempt to gather some MySQL query data; for example, how many queries per second are there? MySQL has a built-in query per second measurement, but that isn't quite what most users would expect. That particular value is calculated for the whole uptime MySQL has, which means it's quite useful, though only for the first few minutes. Longer-running MySQL instances have this number approaching the average value and only slightly fluctuating. When graphed, the queries per second graph gets more and more flat as time passes.
The flexibility of Zabbix allows us to use a different metric. Let's try to create a slightly more meaningful MySQL query items. We can get some data on the SELECT statements with a query like this:
mysql> show global status like 'Com_select';
That is something we should try to get working as a user parameter now. A test command to parse out only the number we are interested in would be as follows:
$ mysql -N -e "show global status like 'Com_select';" | awk '{print $2}'
We are using awk to print the second field. The -N flag for mysql tells it to omit column headers. Now on to the agent daemon configuration—add the following near our other user parameters:
UserParameter=mysql.queries[*],mysql -u zabbix -N -e "show global status like 'Com_$1';" | awk '{print $$2}'It's basically the user parameter definition with the command appended, but we have made a few changes here. Notice how we used [*] after the key, and replaced "select" in Com_select with $1—this way, we will be able to use query type as an item key parameter. This also required adding the second dollar sign in the awk statement. If a literal dollar sign placeholder has to be used with a flexible user parameter, such dollar signs must be prefixed with another dollar sign. And the last thing we changed was adding -u zabbix to the mysql command. Of course, it is best not to use root or a similar access for database statistics, if possible—but if this command is supposed to be run by the Zabbix agent, why specify the username again? Mostly because of an old and weird bug where MySQL would sometimes attempt to connect with the wrong user. If you'd like to see the current status of that issue, see https://bugs.mysql.com/bug.php?id=64522. With the changes in place, save and close the file, then restart the agent daemon.
Now, same as before, let's do a quick zabbix_get test:
$ zabbix_get -s 127.0.0.1 -k mysql.queries[select]
Well, you might have seen this one coming:
ERROR 1045 (28000): Access denied for user 'zabbix'@'localhost' (using password: NO)
Our database user did require a password, but we specified none. How could we do that? The mysql utility allows us to specify a password on the command line with the -p flag, but it is best to avoid it. Placing passwords on the command line might allow other users to see this data in the process list, so it's a good idea to develop a habit—no secret information on the command line, ever.
Tip
On some platforms, some versions of the MySQL client will mask the passed password. While that is a nice gesture from MySQL's developers, it won't work on all platforms and with all software, so such an approach should be avoided just to make it a habit. The password in such a case is likely to be written to the shell history file, making it available to attackers even after the process is no longer running.
How could we pass the password in a secure manner then? Fortunately, MySQL can read the password from a file which we could secure with permissions. A file .my.cnf is searched in several directories, and in our case the best option might be placing it in the user's home directory. On the Zabbix server, execute the following as the zabbix user:
$ touch ~zabbix/.my.cnf
$ chmod 600 ~zabbix/.my.cnf
$ echo -e "[client]
password=<password>" > ~zabbix/.my.cnf
Use the password that the Zabbix database user has. You can remind yourself what it was by taking a look at zabbix_server.conf. If running the above commands as root, also run chown -R zabbix.zabbix ~zabbix after creating the file. Note that we first create and secure the file, and only then place the password in it. Before we proceed with the agent side, let's test whether MySQL utilities pick up the password file. As the zabbix user, run:
$ mysqladmin -u zabbix status
If everything went well with the file we put the password in, it should return some data:
Uptime: 10218 Threads: 23 Questions: 34045 Slow queries: 0 Opens: 114 Flush tables: 2 Open tables: 140 Queries per second avg: 3.331
If that does not work, double-check the password, path, and permissions to the file. We use mysqladmin for this test, but both mysql and mysqladmin should use the same procedure for finding the .my.cnf file and reading the password from it. Now that we know it's working, let's turn to zabbix_get again (no agent restart is needed as we did not modify the agent configuration file this time):
$ zabbix_get -s 127.0.0.1 -k mysql.queries[select]
But the result seems weird:
ERROR 1045 (28000): Access denied for user 'zabbix'@'localhost' (using password: NO)
It's failing still. And with the same error message. If we carefully read the full error, we'll see that the password is still not used. How could that be?
The environment is not initialized for user parameter commands. This includes several common variables, and one we are quite interested in—HOME. This variable is used by the MySQL client to determine where to look for the .my.cnf file. If the variable is missing, this file (and in turn, the password) can't be found. Does that mean we're doomed? Of course not, we wouldn't let such a minor problem stop us. We simply have to tell MySQL where to look for this file, and we can use a very simple method to do that. Edit zabbix_agentd.conf again and change our user parameter line to read as follows:
UserParameter=mysql.queries[*],HOME=/home/zabbix mysql -u zabbix -N -e "show global status like 'Com_$1';" | awk '{print $$2}'This sets the HOME variable for the mysql utility and that should allow the MySQL client to find the configuration file which specifies the password. Again, restart the Zabbix agent and then run the following:
$ zabbix_get -s 127.0.0.1 -k mysql.queries[select]
229420
You'll see a different value, and finally we can see the item is working. But what is that number? If you repeatedly run zabbix_get, you will see that the number is increasing. That looks a lot like another counter—and indeed, that is the number of SELECT queries since the database engine startup. We know how to deal with this. Back to the frontend, let's add an item to monitor the SELECT queries per second. Navigate to Configuration | Hosts, click on Items next to A test host, then click on the Create item button. Fill in these values:
- Name:
MySQL $1 queries per second - Type: Zabbix agent (active)
- Key:
mysql.queries[select] - Type of information: Numeric (float)
- Units:
qps - Store value: Delta (speed per second)
- New application:
MySQL
When you are done, click on the Add button at the bottom. Notice how we used Delta (speed per second) together with Numeric (float) here. For the network traffic items, we chose Numeric (unsigned) instead, as there the value could overflow the float. For this query item, that is somewhere between highly unlikely and impossible, and we will actually benefit a lot from increased precision here. The unit qps is just that—a string. It does not impact the displaying of data in any way besides appearing next to it.
Again, we might have to wait for a few minutes for any data to arrive. If you are impatient, feel free to restart the Zabbix agent daemon, then check the Latest data page:
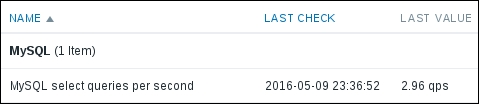
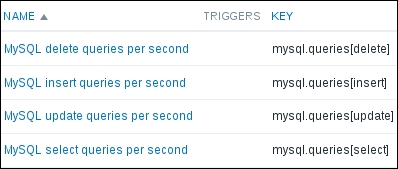
The data is coming in nicely and we can see that our test server isn't too overloaded. Let's benefit from making that user parameter flexible now. Navigate back to Configuration | Hosts, click on Items next to A test host, then click on MySQL select queries per second in the NAME column. At the bottom of the form, click on the Clone button and change select in the key to update, then click on the Add button at the bottom. Clone this item two more times, changing the key parameter to insert and delete. Eventually, there should be four items:
The items should start gathering the data soon; let's try to see how they look all together. Click on Graphs in the navigation header above the item list, then click on Create graph. Enter "MySQL queries" in the Name field and click on Add in the Items section. Mark the checkboxes next to the four MySQL items we created and click on Select at the bottom, then click on the Add button at the bottom. Now let's go to Monitoring | Graphs, select A test host in the Host dropdown and MySQL queries in the Graph dropdown. The graph, after some time, might look like this:
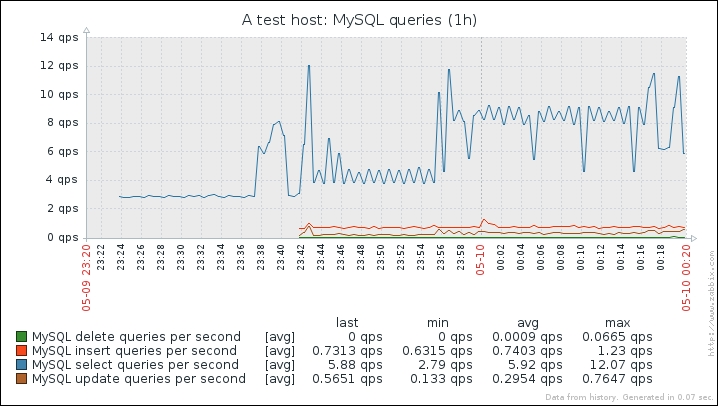
As we can see, the SELECT queries are at the top here, the DELETE ones are almost non-existent. There are other query types, but this should be enough for our user parameter implementation.
We saw that the flexibility of user parameters is basically unlimited. Still, there might be cases when additional measures have to be applied.
Commands to be executed can be specified in the Zabbix agent daemon configuration file on a single line only. Pushing whole scripts there can be very messy and sometimes it can be hard to figure out the quotation. In such cases, a wrapper script has to be written. Such a script can be useful if parsing data requires more complex actions or if parsing out multiple different values cannot be easily done with flexible user parameters.
It is important to remember that using user parameters and custom scripts requires these to be distributed on all monitored hosts—that involves the scripts themselves and changes to the Zabbix agent daemon's configuration file.
This can soon become hard to manage. Various systems will require different user parameters, thus you'll either end up with a messy agent configuration file containing all of them, or a myriad of different combinations. There's a quite widespread feature to help with this problem—configuration file inclusion. You can specify the inclusion of individual files by adding to zabbix_agentd.conf entries like these:
Include=/etc/zabbix/userparameters/zabbix_lm_sensors.conf
Include=/etc/zabbix/userparameters/zabbix_md_raid.conf
If such a file is missing, Zabbix will complain, but will still start up. Inclusions can be nested—you can include one file which in turn includes several others, and so on.
It's also possible to include whole directories—in that case, all files placed there will be used. This method allows other packages to place, for example, user parameter configuration in a specific directory, which will then be automatically used by Zabbix:
Include=/etc/zabbix/userparameters/
Or, to be sure that only files ending with "conf" are included:
Include=/etc/zabbix/userparameters/*.conf
Then other packages would only need to place files such as zabbix_lm_sensors.conf or zabbix_md_raid.conf in the directory /etc/zabbix/userparameters and they would be used without any additional changes to the agent daemon configuration file. Installing the Apache web server would add one file, installing Postfix another, and so on.
There are also cases when user parameters are best replaced with a different solution. Usually, that will be when:
- The script takes a long time
- The script returns many values
In the first case, the script could simply time out. The default timeout on the agent side is 3 seconds, and it is not suggested to increase it in most cases.
In the second case, we might be interested in 100 values that a script could return in a single invocation, but Zabbix does not allow several values to be obtained from a single key or from a single invocation, thus we would have to run the script 100 times—not very efficient.
There are several potential solutions, with some drawbacks and benefits for each case:
- A special item (usually an external check, discussed below, or another user parameter) that could send the data right away using
zabbix_senderif the data collection script is quick. If not, it could write data to temporary files or invoke another script withnohup. crontab: A classic solution that can help both when the script takes a long time and when it returns many values. It does have the drawback of having interval management outside Zabbix. Values are usually sent right away usingzabbix_sender(discussed later in this chapter), although they could also be written to temporary files and read by other items using thevfs.file.contentsorvfs.file.regexpkey.- A special item (usually another user parameter) that adds an
atdjob. This solution is a bit more complicated, but allows us to keep interval management in Zabbix while still allowing the use of long-running scripts for data collection. See http://zabbix.org/wiki/Escaping_timeouts_with_atd for more detail.