
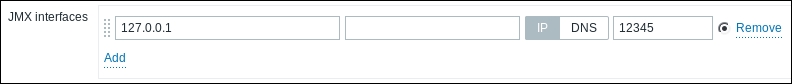
Let's create a separate host for JMX monitoring. Navigate to Configuration | Hosts, and click on Create host. Enter Zabbix Java gateway in the Host name field, clear everything in the In groups listbox, and enter Java in the New group field. We will need JMX items on this host: remove the default agent interface and click on Add next to JMX interfaces. In our case, the gateway is running on the local host, so we can leave the IP address at the default, 127.0.0.1. But what about the port? We had the Java gateway listen on 10052, but then there was also that 12345 port in the startup.sh script. If a confusion arises, we should think about which functionality is available on each of these ports. On port 10052, we had the gateway itself, which was the port Zabbix server connects to. We already saw this port set in the server configuration file. Normally, the gateway would then connect to some other Java application to query JMX information.
The 12345 port was in the lines we uncommented in the gateway's startup.sh script, and that was the JMX interface for the gateway. That was also what we wanted to monitor: our Java application. After Zabbix server connects to the Java gateway on port 10052, we expect the gateway to connect to itself, on port 12345:
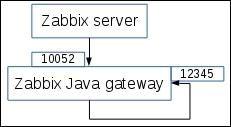
Thus, in the host interface, we would want to use port 12345—and surprise surprise, that is also the default:

Note
The JMX system can actually return a different IP address and port that the JMX querying client should connect to. Zabbix uses Java functionality that automatically obeys this information, but in some cases, it can be wrong. If you see error messages and the Zabbix Java gateway seems to connect to a different address or port than the one configured in the host properties, check the configuration of the target Java application, specifically the Djava.rmi.server.hostname and Dcom.sun.management.jmxremote.rmi.port parameters.
The rest of the host configuration should be sufficient for our needs—click on the Add button at the bottom. Now, make sure Java is selected in the Group dropdown, click on Items next to Zabbix Java gateway, and click on Create item. Enter the following data:
- Name:
Used heap memory - Type: JMX agent
- Key:
jmx[java.lang:type=Memory,HeapMemoryUsage.used] - Units:
B
When done, click on the Add button at the bottom. Check this item in the latest data section after a few minutes—it should be collecting values successfully.
Creating items on the server and then waiting for them to be updated through the gateway can be quite cumbersome if we don't know the exact parameters beforehand. We could query the gateway manually using netcat and similar tools, but that's not that easy either. There is an easier method with zabbix_get, courtesy of the Zabbix community member Bunjiboys. The following simple script acts as a wrapper:
#!/bin/bash
ZBXGET="/usr/bin/zabbix_get"
# accepts positional parameters:
# 1 - JAVA_GW_HOST
# 2 - JAVA_GW_PORT
# 3 - JMX_SERVER
# 4 - JMX_PORT
# 5 - ITEM_KEY
# 6 - USERNAME
# 7 - PASSWORD
QUERY="{"request": "java gateway jmx","conn": "$3","port": $4,"username": "$6","password": "$7", "keys": ["$5"]}"
$ZBXGET -s $1 -p $2 -k "$QUERY"
If you save this as zabbix_get_jmx and make it executable, querying an item key through the gateway can be done like this:
$ ./zabbix_get_jmx localhost 10052 java-application-server.local.net 9999 'jmx["java.lang:type=Threading","PeakThreadCount"]'
In this example, the JMX instance is listening on port 9999. Notice the escaping of double quotes in the item key. The result will be raw JSON from the Zabbix Java gateway protocol:
{"response":"success","data":[{"value":"745"}]}When Zabbix server queries the gateway, it will parse the numeric value out of that JSON—745 in this case.
Tip
This example script doesn't do any error checking—check out https://www.zabbix.org/wiki/Docs/howto/zabbix_get_jmx for any potential future improvements.
With a Java application server, monitoring is not initiated by the actual Java application developers often enough, and it is quite often that it's not clear what would be a good set of things to monitor first. In general, the same advice applies as with any other system—somebody who knows the monitored application should determine what is monitored. It's even better if the available Java developers are reasonable and actually implement additional JMX items to monitor application-specific logic. If that is not easy to achieve, one can always start with a basic set of memory usage, thread count, garbage collector, and other generic metrics. A few potentially useful parameters are as follows:
jmx["java.lang:type=ClassLoading","LoadedClassCount"]: How many classes have been loadedjmx["java.lang:type=Memory",NonHeapMemoryUsage.used]: We already monitored the heap memory usage on the gateway; this will monitor the non-heap memory usage
In general, it's fairly hard to suggest a static list of things to monitor for JMX—there are several garbage collectors, and exact keys for garbage collection monitoring will differ depending on which one is in use. Zabbix also provides a couple of templates out of the box for generic and Tomcat-specific JMX monitoring, which could be a good start.
What if we would like to use multiple Java gateways—maybe one at each datacenter, or even one on each Java application server so that JMX connections do not happen over the network? Zabbix server only supports a single Zabbix gateway. Attaching multiple Java gateways to a single server is actually possible using Zabbix proxies, but we will discuss that in Chapter 19, Using Proxies to Monitor Remote Locations.