
There's yet another item category that is Windows-specific: a dedicated key for Windows service state monitoring. Let's try to monitor a service now. First we have to figure out how to refer to this service. For that, open the services list and then open up the details of a service—let's choose DNS Client:
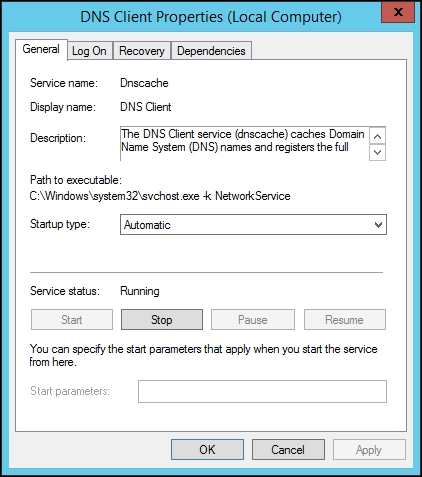
Look at the top of this tab. Service name is the name we will have to use, and we can see that it differs noticeably from the display name—instead of using DNS Client, the name is Dnscache. Let's create the item now. Navigate to Configuration | Hosts, click on Items next to the Windows host, then click on Create item. Enter these values:
- Name:
DNS client service state - Key:
service.info[Dnscache]
Tip
Service names are case insensitive.
The key used here, service.info, is new in Zabbix 3.0. Older versions of Zabbix used service_state key. This key is deprecated but still supported, and you are likely to see it in older Zabbix installations and templates. The service.info key has more parameters—for the complete documentation, consult the Zabbix manual.
When done, click on the Add button at the bottom, open Monitoring | Latest data, and look for our newly added item:
So data is gathered, and the state is "0". That's probably normal, but how can we know what the state number means? Back in Configuration | Hosts, click on Items next to Windows host and click on DNS client service state in the NAME column. Look at our old friend, the Show value property. Click on the Show value mappings link and examine the mapping near the bottom of the list:
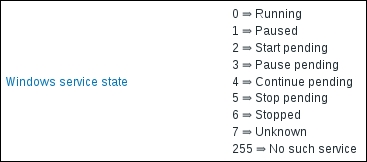
It turns out there's already a predefined mapping for Windows service states available. Close this window and choose Windows service state in the Show value dropdown, then click on Update. Back in Monitoring | Latest data, verify that the service state is now displayed in a much more user-friendly way:
Now we will be able to easily identify different service states in the frontend. With the item in place, let's also create a trigger that will alert us when this service has stopped. Go to Configuration | Hosts, click on Triggers next to Windows host, and click on Create trigger. Enter DNS client service down on {HOST.NAME} in the Name field, then click on Add next to the Expression field. Click on Select next to the Item field, choose DNS client service state, and click on Insert. But wait, the value of 0 was for when the service was running; we should actually test for the value not being 0. We just avoided using the dropdown function that changes the insert expression:
{Windows host:service.info[Dnscache].last()}<>0Change the severity to Warning and click on the Add button at the bottom. Unless this is a production system, it should be pretty safe to stop this service—do so, and observe Monitoring | Triggers; select Windows servers in the Group dropdown. Zabbix should now warn you that this service is down:

Sometimes we are not interested in the exact details of every service, and we might have to configure an item and trigger for each of them manually. Instead, we might want to see a high-level overview; for example, whether any of the services that are started automatically have stopped. Zabbix provides an item that allows you to make such a comparison very easily: services. It allows us to retrieve lists of services based on different parameters, including ones that should be started automatically and are stopped. How can we use this?
An item should be added with the following key:
services[automatic,stopped]
This will take care of getting the required data. Whenever a service that is set to start automatically is stopped, it will be listed in the data from this item.
It is also possible that on some Windows versions there will be services that are supposed to start up automatically and shut down later. In this case, they would appear in the listing and break our monitoring. Luckily, Zabbix has a solution for such a problem, too—we can add third parameter to this key and list services to be excluded from this check. For example, to exclude the RemoteRegistry and sppsvc services, the key would be:
services[automatic,stopped,"RemoteRegistry,sppsvc"]
Notice how the services to be excluded are comma-delimited, and the whole list is included in double quotes.
Tip
If the list of such services is different between hosts, consider using a user macro to hold the service list. We discussed user macros in Chapter 8, Simplifying Complex Configuration with Templates.
But how do we check that everything is good in a trigger? If the list is empty, the Zabbix agent returns 0. As a result, by simply checking whether the last value was zero, we can trigger when an automatically started service is stopped. A trigger expression for such a check would be:
{Windows host:services[automatic,stopped].last()}<>0Of course, you can apply a method—such as using the count() function—to only fire the trigger after it has been non-zero for more than a single check:
{Windows host:services[automatic,stopped].count(#3,0)}=0Such a trigger expression will only fire if there has been at least one such stopped service in all of the last three checks.
The preceding method just tells you that some service that was supposed to be running has stopped. To see which service that is, we'd have to look at the item values. We can actually monitor all services individually, as Zabbix has supports Windows service discovery since version 3.0. Let's discover all Windows services and monitor some parameter on all of them—we can choose the service description here.
Navigate to Configuration | Hosts, click on Discovery next to Windows host, and click on Create discovery rule. Fill in the following:
- Name:
Windows service discovery - Key:
service.discovery - Update interval:
300
We used a built-in agent key and increased the update interval. In production, it is probably a good idea to increase the interval even more; an average default interval for discovery rules of one hour is likely a good idea. When done, click on the Add button at the bottom. We have the rule itself; now we need some prototypes—click on Item prototypes, then click on Create item prototype. Before we fill in the data, it would be useful to know what this discovery item returns—an example for one service is as follows:
{
    "{#SERVICE.STARTUP}" : 0,
    "{#SERVICE.DISPLAYNAME}" : "Zabbix Agent",
    "{#SERVICE.DESCRIPTION}" : "Provides system monitoring",
    "{#SERVICE.STATENAME}" : "running",
    "{#SERVICE.STARTUPNAME}" : "automatic",
    "{#SERVICE.USER}" : "LocalSystem",
    "{#SERVICE.PATH}" : ""C:\zabbix\zabbix_agentd.exe" --config "c:\zabbix\zabbix_agentd.win.conf"",
    "{#SERVICE.STATE}" : 0,
    "{#SERVICE.NAME}" : "Zabbix Agent"
}
Tip
The Zabbix agent can be queried for the raw LLD data using zabbix_get. We discussed low-level discovery in more detail in Chapter 12, Automating Configuration.
This snippet also shows what other things we could monitor for each service. For now, we want to extract descriptions for all services, but to add the items we need the actual service names. Although the description is available here, we will query it in the item, so for item prototypes it will actually be the macro {#SERVICE.NAME}. With this knowledge, we are ready to fill in the item prototype form:
- Name:
Service $1 description - Key:
service.info[{#SERVICE.NAME},description] - Type of information: Character
- Update interval:
300
When done, click on the Add button at the bottom. With our discovery running every five minutes, it might take up to five minutes for this prototype to generate actual items, and then it would take up to six minutes for these items to get their first value—the added time of configuration cache update and item interval. First, go to item configuration for the Windows host. After a while, our discovery rule should add the items:
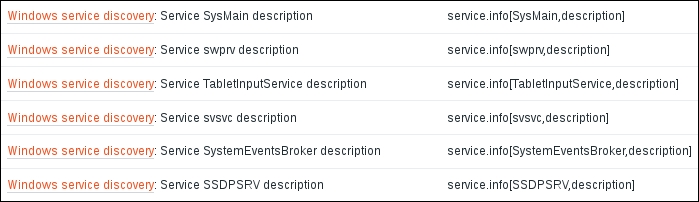
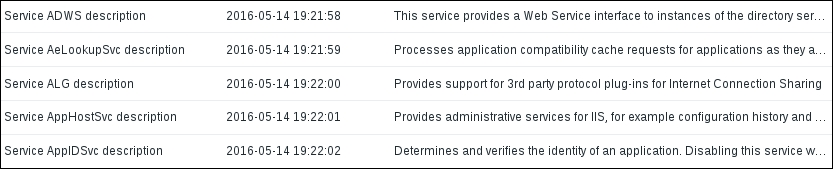
There will likely be a fairly large number of such items. Visiting Monitoring | Latest data, after a few more minutes we should see descriptions for all services:
A more common approach would be to monitor the current service state or its startup configuration—anything the service.info key supports should be possible.