 Getting an overview of the latest data
by Andrea Vacche, Patrik Uytterhoeven, Rihards Olups
Zabbix: Enterprise Network Monitoring Made Easy
Getting an overview of the latest data
by Andrea Vacche, Patrik Uytterhoeven, Rihards Olups
Zabbix: Enterprise Network Monitoring Made Easy
- Zabbix: Enterprise Network Monitoring Made Easy
- Table of Contents
- Zabbix: Enterprise Network Monitoring Made Easy
- Zabbix: Enterprise Network Monitoring Made Easy
- Credits
- Preface
- I. Module 1
- 1. Getting Started with Zabbix
- The first steps in monitoring
- Zabbix features and architecture
- Installation
- Summary
- 2. Getting Your First Notification
- 3. Monitoring with Zabbix Agents and Basic Protocols
- 4. Monitoring SNMP Devices
- 5. Managing Hosts, Users, and Permissions
- 6. Detecting Problems with Triggers
- 7. Acting upon Monitored Conditions
- 8. Simplifying Complex Configurations with Templates
- 9. Visualizing Data with Graphs and Maps
- 10. Visualizing Data with Screens and Slideshows
- 11. Advanced Item Monitoring
- 12. Automating Configuration
- 13. Monitoring Web Pages
- 14. Monitoring Windows
- 15. High-Level Business Service Monitoring
- 16. Monitoring IPMI Devices
- 17. Monitoring Java Applications
- 18. Monitoring VMware
- 19. Using Proxies to Monitor Remote Locations
- 20. Encrypting Zabbix Traffic
- 21. Working Closely with Data
- 22. Zabbix Maintenance
- A. Troubleshooting
- B. Being Part of the Community
- 1. Getting Started with Zabbix
- II. Module 2
- 1. Zabbix Configuration
- 2. Getting Around in Zabbix
- 3. Groups, Users, and Permissions
- 4. Monitoring with Zabbix
- Introduction
- Active agents
- Passive agents
- Extending agents
- SNMP checks
- Internal checks
- Zabbix trapper
- IPMI checks
- JMX checks
- Aggregate checks
- External checks
- Database monitoring
- Checks with SSH
- Checks with Telnet
- Calculated checks
- Building web scenarios
- Monitoring web scenarios
- Some advanced monitoring tricks
- Autoinventory
- 5. Testing with Triggers in Zabbix
- 6. Working with Templates
- 7. Data Visualization and Reporting in Zabbix
- 8. Monitoring VMware and Proxies
- 9. Autodiscovery
- 10. Zabbix Maintenance and API
- C. Upgrading and Troubleshooting Zabbix
- III. Module 3
- 1. Deploying Zabbix
- 2. Distributed Monitoring
- 3. High Availability and Failover
- Understanding high availability
- Understanding the levels of IT service
- Some considerations about high availability
- Implementing high availability on a web server
- Configuring the Zabbix server for high availability
- Implementing high availability for a database
- Summary
- 4. Collecting Data
- 5. Visualizing Data
- 6. Managing Alerts
- 7. Managing Templates
- 8. Handling External Scripts
- 9. Extending Zabbix
- 10. Integrating Zabbix
- D. Bibliography
- Index
This page is the Zabbix page where we can get an overview of all the data that we have been monitoring with our Zabbix server. After all, we want to know if we have received any values, isn't it ?
To be able to check anything on this page we need to have a running Zabbix setup with a host that has some active items on it already. It would be great if the item is also configured properly so that we can see the values that we have received.
In our Zabbix frontpage, go to Monitoring | Latest Data, this page will give you an overview of all the latest data that was gathered by Zabbix.
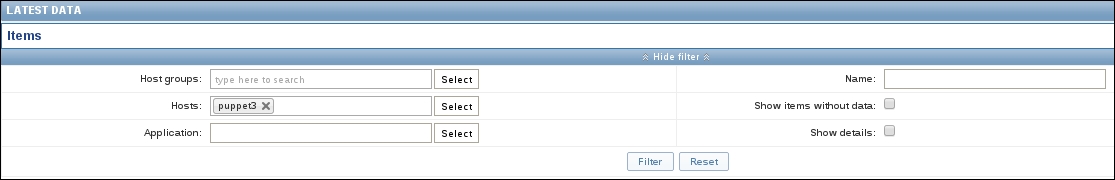
- First thing we have to do is select the group and or the server where we want to see the latest data from. This can be done by typing the names in the correct fields or by clicking the Select button for each field. When you type in a field, Zabbix will try to guess the correct name. When you are ready, press Filter:
- Once we have selected the correct server or group where we want to get our latest data from, we get to see depending on how many items we have created a lot of data on our screen:
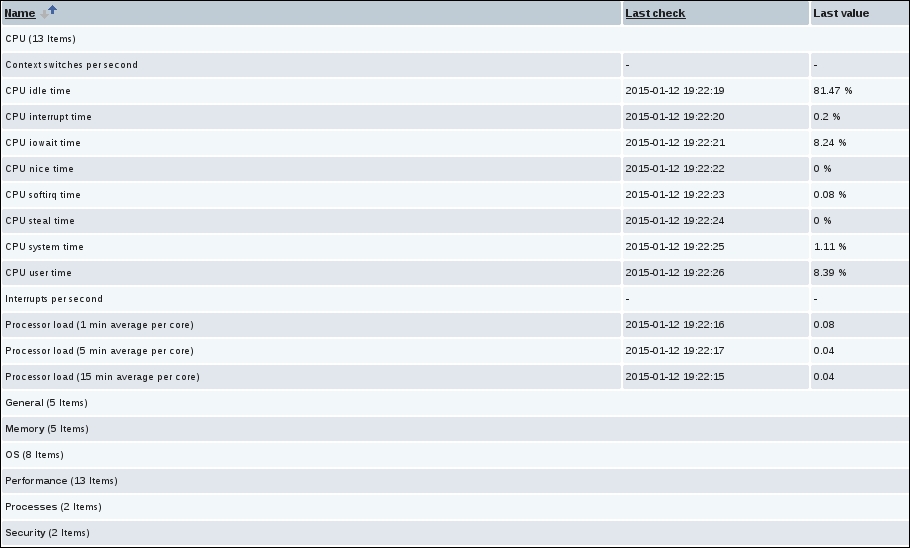
- The first column will show us a list with names. Those are the names from the application that we linked to our items. So when we click on it, we will get a list of all items related to that application.
- In the next column Last check, we will see when was the last time our item was checked by Zabbix.
- The next column Last value tells us what was the latest value Zabbix has received from our item.
- The column Change will show us how much the value was changed since the previous check. This value can be either positive or negative. If you see no value at all and only a -, it means that the data was not changed since the last check.
- If you are missing an item in the list, it probably means that Zabbix has no data yet. You can check this by clicking on the filter on top and selecting the Show items without data option in the filter. Then click on the Filter button and normally your item will pop up in the list with the column with Last value, being without value for this item.
- Our last column will show us a graph or the history from our item. This way we can easily see how our item has behaved over a specific period in time.
The latest data page will show you the latest data that Zabbix has received for each item that we have created. It will also show us what the difference was with the previous value from that item and we also have a link to watch a graph from the data of that item.
Since version 2.2.4, this page only shows the latest data of the last 24 hours. This limitation was introduced to keep load times lower of this page. The value can be changed if you like in the /usr/share/zabbix/include/defines.inc.php file. Here you can change the value of the ZBX_HISTORY_PERIOD parameter to something else in seconds.
If you are running one of the first 2.2 releases, it is possible that the latest data page only refreshes the values instead of the whole page. This feature was introduced with 2.2 to reduce load but had in some cases, the opposite effect. So best is that you upgrade to the latest version of Zabbix.
-
No Comment