
With all the benefits that a proxy brings, one would be tempted to use them a lot—and a good idea that would be, too. Proxies are really great. There's still the issue of monitoring availability for hosts behind proxies. If a proxy goes down or cannot communicate with the Zabbix server, we would be missing data for all the hosts behind that proxy. If we used the nodata() trigger function to detect unavailable hosts (we could call such triggers availability triggers), that could mean thousands of hosts declared unavailable. Not a desirable situation. There is no built-in dependency for hosts behind a proxy, but we can monitor proxy availability and set trigger dependencies for all hosts behind that proxy. But what should we set those dependencies to? Let's discuss the available ways to monitor proxy availability and their potential shortcomings.
There was the last access column in Administration | Proxies. Of course, looking at it all the time is not feasible, thus it can also be added as an internal item. To create such an item, let's go to Configuration | Hosts, click on Items next to the host that runs your proxy, and click on Create item. Fill in the following values:
- Name:
$2: last access - Type: Zabbix internal
- Key:
zabbix[proxy,First proxy,lastaccess] - Units:
unixtime
In the key here, the second parameter is the proxy name. Thus, if your proxy was named kermit, the key would become zabbix[proxy,kermit,lastaccess].
Tip
If items like these are created on hosts that represent the proxy system and have the same name as the proxy, a template could use the {HOST.HOST} macro as the second parameter in this item key. We discussed templates in Chapter 8, Simplifying Complex Configuration with Templates.
When done, click on the Add button at the bottom. Notice how we used a special unit here—unixtime. Now what would it do? To find out, navigate to Monitoring | Latest data, expand the Filter, select the host you created the last item on and enter proxy in the Name field, then click on the Filter button. Look at the way data is presented here—we can see very nicely, in a human-readable form, when the proxy last contacted the Zabbix server:
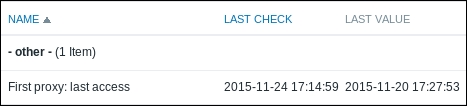
So this item will be recording the time when the proxy last contacted the Zabbix server. That's great, but hardly enough to notice problems in an everyday routine—we already know quite well that a trigger is absolutely needed. Here, the already familiar fuzzytime() function comes to the rescue. Navigate to Configuration | Hosts, click on Triggers next to the host you created the proxy last access item on, then click on the Create trigger button.
Let's say we have a fairly loaded and critical proxy—we would like to know when three minutes have passed without the proxy reporting back. In such a case, a trigger expression like this could be used:
{host:zabbix[proxy,proxy name,lastaccess].fuzzytime(180)}=0As we might recall, the proxy connected to the server in two cases—it either synchronized the configuration, or sent the collected data. What if, for some reason, all occurrences of both of these events are further apart than three minutes? Luckily, the Zabbix proxy has a heartbeat process, which reports back to the server at regular intervals. Even better, this timing is configurable. Again, take a look at zabbix_proxy.conf, this time looking for the HeartbeatFrequency variable, which by default looks like this:
# HeartbeatFrequency=60
Specified in seconds, this value means that every minute the proxy will report back to the server, even if there are no new values to send. The lastaccess item is quite a reliable way to figure out when a proxy is most likely down or at least inaccessible, even if it would not be sending data for a longer period of time.
For our trigger, fill in the following values:
- Name:
Proxy "First proxy" not connected for 3 minutes - Expression:
{Another host:zabbix[proxy,First proxy,lastaccess].fuzzytime(3m)}=0 - Severity: High
We could have used 180 in place of 3m, but the time suffix version is a bit easier to read. Time suffixes were discussed in Chapter 6, Detecting Problems with Triggers. When done, click on the Add button at the bottom.
This combination of an item and a trigger will nicely alert us when the proxy will be unavailable. Now we just have to set up trigger dependencies for all availability triggers behind this proxy on this proxy last access trigger.
Unfortunately, there's a common problem situation. When proxy-server communication is interrupted, the proxy last access trigger fires and masks all other triggers because of the dependency. While the proxy is unable to connect to the server for some time, it still collects the values. Once the communication is restored, the proxy sends all the values to the server, older values first. The moment the first value is sent, the last access item is updated and the trigger resolves. Unfortunately, at this point the proxy is still sending values that were collected 5, 30, or 60 minutes ago. Any nodata() triggers that check a shorter period will fire. This makes the proxy trigger dependency work only until the proxy comes back, and results in a huge event storm when it does come back. How can we solve it? We could try to find out how many unsent values the proxy has, and if there are too many, ignore all the triggers behind the proxy—essentially, treating a proxy with a large value buffer the same as an unreachable proxy.
We can turn to Zabbix internal items to figure out how large the proxy buffer is—that is, how many values it has to send to the Zabbix server. Let's go to Configuration | Hosts, click on Items next to Another host, and click on Create item. Fill in the following values:
- Name:
First proxy: buffer size - Type: Zabbix internal
- Key:
zabbix[proxy_history]
When done, click on the Add button at the bottom. With the default proxy configuration update interval of one hour, it might take quite some time before we can see the result of this item. To speed up configuration update, run the following on the proxy host:
# zabbix_proxy --runtime-control config_cache_reload
The proxy will request item configuration from the server and update its own cache. After a short while, we should be able to see the result in the latest data page:
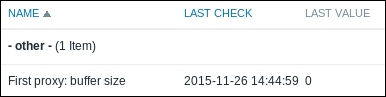
What is that value, though? It's quite simply the number of values that are still in the proxy buffer and must be sent to the server. This might allow us to create a trigger against this item. Whenever the buffer is bigger than a hundred, two hundred, or a thousand values, we would consider the proxy data not up-to-date and make all host triggers depend on the buffer size. Except that there's still a significant problem. Values for this item are kept in the same proxy buffer it monitors and are subject to the same sequential sending, older values being sent first. With this item, we would still suffer from the same problem as before—while the proxy was unavailable, the proxy buffer item would hold 0 or some other small value. As values start we to flow in, individual host triggers would fire, and only after some time would we see that the buffer was actually really large. It would be useful for some debugging later, but would not help with masking the hosts behind the proxy. Is there a solution then?
A solution could be some method that would send us the proxy buffer size, bypassing the buffer itself. Zabbix does not offer such a method, thus we will have to implement it ourselves. Before we do that, let's figure out how we could obtain information on the buffer size. For that, we will delve into the proxy database.
On the proxy host, run:
$ sqlite3 /tmp/zabbix_proxy.db
The proxy keeps all of the collected values in a single table, proxy_history. Let's grab the last three collected values:
sqlite> select * from proxy_history order by id desc limit 3;
1850|24659|1448547689|0||0|0|0|749846420|0|0|0|0
1849|23872|1448547664|0||0|0.000050|0|655990544|0|0|0|0
1848|24659|1448547659|0||0|0|0|744712272|0|0|0|0
We will discuss other fields in a bit more detail in Chapter 21, Working Closely with Data, but for now it is enough to know that the first field is a sequential ID. Still, how does the proxy know which values it has sent to the server already? Let's look at the IDs table:
sqlite> select * from ids where table_name='proxy_history';
proxy_history|history_lastid|1850
The history_lastid value here is the last ID that has been synchronized to the server. On a busy proxy, you might have to run these statements really quickly to see the real situation, as new values will be constantly added and sent to the server. We can get the current buffer (unsent values) size with this:
sqlite> select (select max(proxy_history.id) from proxy_history)-nextid from ids where field_name='history_lastid';
It will calculate the difference between the biggest ID and the history_lastid value. On our proxy, this will likely return 0 all the time.
Now we should put this in an item. The most important thing is to make sure this item is processed directly by the server, without involving the Zabbix proxy. We have several options:
- Passive agent item
- Active agent item
- Zabbix trapper item that is populated by
zabbix_sender
For a passive agent, the server should query it directly. For an active agent, it should point at the Zabbix server. For the trapper item, zabbix_sender should be used to connect to the Zabbix server. In all three cases, the host should be assigned to be monitored by the Zabbix server. If we are using internal monitoring to collect proxy values in a dedicated host, a separate host will be needed to collect the buffer data. This way, we will avoid these values getting stuck in the proxy buffer.
For the agent items, we could use a UserParameter like this:
UserParameter=proxy.buffer,sqlite3 /tmp/zabbix_proxy.db "select (select max(proxy_history.id) from proxy_history)-nextid from ids where field_name='history_lastid';"
As for the Zabbix trapper approach, it could be run from crontab or using any other method. The command would be similar to this:
zabbix_sender -z zabbix_server -s target_host -k item_key -o $(sqlite3 /tmp/zabbix_proxy.db "select (select max(proxy_history.id) from proxy_history)-nextid from ids where field_name='history_lastid';")
Here we use the basic zabbix_sender syntax, but the value is obtained from the SQLite query. See Chapter 11, Advanced Item Monitoring for more information on UserParameters and zabbix_sender. The Zabbix trapper item would receive the same data as the internal buffer monitoring—the buffer size. The trigger would check for this buffer exceeding some threshold.
Note that all three methods are likely to result in some missing values for the buffer item—the values would not be available while the connection between server and proxy is down. The active agent item approach would suffer less as it has in-memory buffer, but it there might still be missing values. If it would be valuable to know how the buffer changed during the communication breakdown; this item could be used for the trigger and an internal item, as discussed earlier, for more complete buffer statistics.
Regarding triggers and dependencies, it is suggested to make the buffer trigger depend on the last access trigger. This way, hosts behind the proxy will be silenced if the proxy disappears completely, and when the proxy comes back with a large buffer, the buffer trigger will keep those hosts silent.