 Monitoring Zabbix
by Andrea Vacche, Patrik Uytterhoeven, Rihards Olups
Zabbix: Enterprise Network Monitoring Made Easy
Monitoring Zabbix
by Andrea Vacche, Patrik Uytterhoeven, Rihards Olups
Zabbix: Enterprise Network Monitoring Made Easy
- Zabbix: Enterprise Network Monitoring Made Easy
- Table of Contents
- Zabbix: Enterprise Network Monitoring Made Easy
- Zabbix: Enterprise Network Monitoring Made Easy
- Credits
- Preface
- I. Module 1
- 1. Getting Started with Zabbix
- The first steps in monitoring
- Zabbix features and architecture
- Installation
- Summary
- 2. Getting Your First Notification
- 3. Monitoring with Zabbix Agents and Basic Protocols
- 4. Monitoring SNMP Devices
- 5. Managing Hosts, Users, and Permissions
- 6. Detecting Problems with Triggers
- 7. Acting upon Monitored Conditions
- 8. Simplifying Complex Configurations with Templates
- 9. Visualizing Data with Graphs and Maps
- 10. Visualizing Data with Screens and Slideshows
- 11. Advanced Item Monitoring
- 12. Automating Configuration
- 13. Monitoring Web Pages
- 14. Monitoring Windows
- 15. High-Level Business Service Monitoring
- 16. Monitoring IPMI Devices
- 17. Monitoring Java Applications
- 18. Monitoring VMware
- 19. Using Proxies to Monitor Remote Locations
- 20. Encrypting Zabbix Traffic
- 21. Working Closely with Data
- 22. Zabbix Maintenance
- A. Troubleshooting
- B. Being Part of the Community
- 1. Getting Started with Zabbix
- II. Module 2
- 1. Zabbix Configuration
- 2. Getting Around in Zabbix
- 3. Groups, Users, and Permissions
- 4. Monitoring with Zabbix
- Introduction
- Active agents
- Passive agents
- Extending agents
- SNMP checks
- Internal checks
- Zabbix trapper
- IPMI checks
- JMX checks
- Aggregate checks
- External checks
- Database monitoring
- Checks with SSH
- Checks with Telnet
- Calculated checks
- Building web scenarios
- Monitoring web scenarios
- Some advanced monitoring tricks
- Autoinventory
- 5. Testing with Triggers in Zabbix
- 6. Working with Templates
- 7. Data Visualization and Reporting in Zabbix
- 8. Monitoring VMware and Proxies
- 9. Autodiscovery
- 10. Zabbix Maintenance and API
- C. Upgrading and Troubleshooting Zabbix
- III. Module 3
- 1. Deploying Zabbix
- 2. Distributed Monitoring
- 3. High Availability and Failover
- Understanding high availability
- Understanding the levels of IT service
- Some considerations about high availability
- Implementing high availability on a web server
- Configuring the Zabbix server for high availability
- Implementing high availability for a database
- Summary
- 4. Collecting Data
- 5. Visualizing Data
- 6. Managing Alerts
- 7. Managing Templates
- 8. Handling External Scripts
- 9. Extending Zabbix
- 10. Integrating Zabbix
- D. Bibliography
- Index
When you run Zabbix, it's not always easy to know how many pollers you need, for example for SNMP, IPMI, and so on. To find out more about this, Zabbix has some built-in health checks. In this topic, we will show you how to read them.
For this recipe, make sure that you are a Zabbix administrator and that you have your agent configured on the Zabbix server. Also make sure that the template Template App Zabbix Server is linked with your Zabbix host.
From the menu, go to Monitoring | Latest data and select the Zabbix server as host to see. Select Zabbix server from the item list to get an overview of the data of all items:
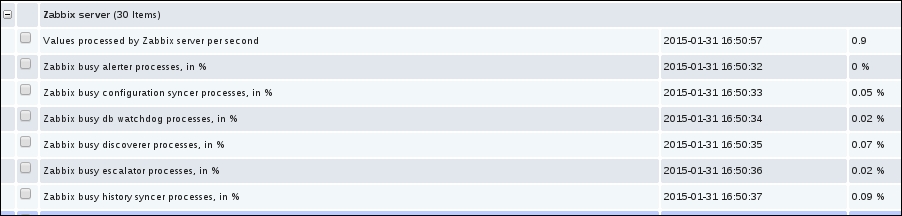
Here we have an easy overview of how much our pollers are busy or idle. Remember that in our Zabbix 2.4, we have graphs automatically generated in Latest data, so we can click on those graphs and see easy if, for example, at a certain time pollers were not enough available.
The data that we see here is based on the internal items, more specifically this one: zabbix[process,<type>,<mode>,<state>].
With this item, we first have to choose a process type that we want to monitor. We select a type from a long list.. Here we specify what we want to monitor, be it a trapper, ICMP pinger, housekeeper, or anything else.
Next we specify the mode. The mode will tell us what data we want to see from our process, for example .avg, max, min, and so on.
And as last option, we specify the state from our process. Here we will specify if we want to monitor the busy or idle state from our process.
For a full list of types that can be used, check the Zabbix documentation and look for zabbix[process,<type>,<mode>,<state>].
https://www.zabbix.com/documentation/2.4/manual/config/items/itemtypes/internal.
-
No Comment