
It's great when Zabbix runs smoothly—we get all the data, nice graphs, and alerts. To keep it running like that, we should follow the health of Zabbix itself, be ready to recover from disastrous events, and upgrade to the latest version every now and then. In this chapter, we will cover the following topics:
- Monitoring the internals of Zabbix: Caches, busy rates, performance items, and other data that reveals how well Zabbix is feeling
- Making backups: Suggestions on how to perform backups and potential restore strategies
- Upgrading Zabbix: How to know what changes to expect from new versions, which components are compatible with others in different versions, and how to perform the upgrade itself
We will also review generic suggestions regarding Zabbix setup to reduce performance issues and take a look at the audit log—a way to see who made changes to the Zabbix configuration and when, although this feature has some problems that we will make sure to find out. We'll finish this chapter with a look at all the configuration parameters in the server, proxy, and agent configuration files, concentrating on the ones we haven't discussed so far.
Zabbix can monitor a lot of things about other systems, but what do we know about Zabbix itself? We can see a few basic indicators in the Zabbix frontend right away. In the frontend, go to Reports | Status of Zabbix. Here, we can observe high-level information, such as whether the Zabbix server is running, and values, such as the number of hosts, items, triggers, and users online.
This information is also visible as a widget in the dashboard. Both the widget and the report are available to super admin users only.
Let's look at the value next to Required server performance, new values per second. It is the main value when determining how large a Zabbix installation is:
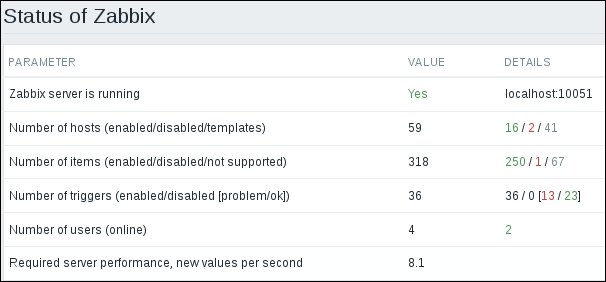
Why is the new values per second setting so important? While knowing how many hosts or even items a system has is important, the underlying load could vary a lot. For example, we could have a system with 1,000 hosts, 100 items each, but the items would be polled once every 15 minutes. In this case, the approximate expected New Values Per Second (NVPS) would be 111. Or we could have only 10 hosts with 100 items per host, but if the interval were 10 seconds (that is a very low interval; if possible, never use such a low interval), the total expected NVPS would be 100. As we can see, host and item count have an impact, but so does the average interval. NVPS is a generic value that can be compared to other systems more easily. In our installation, the expected NVPS, based on our current host and item configuration, is likely to be somewhere between 7 and 9. This means that every second, the Zabbix server is expected to receive and process that many historical values—this also includes calculating any trigger expressions, calculating trend information for numeric items, and storing any resulting events and these historical values in the database. It's quite a lot of seemingly invisible work for each value.
We can see the value for the current configuration in the Zabbix status report, but how can we calculate the expected NVPS for a larger system we are building, without adding all the hosts and items? If we had 60 items on a single host each polled once per minute, the NVPS could be calculated like this:
<item count> / <item interval>
So, 60 items per minute would result in 1 NVPS. By the way, one item per minute would be 1/60 or 0.01557. To get the total NVPS in the projected environment, we would simply multiply it all by the amount of hosts:
<average item count per host> / <average item interval> * <total host count>
Plug in various values and see how the expected NVPS changes as one of these values is changed. The more hosts you have, the more impact the average interval and average item count per host will have.
The value that the frontend gives us is a nice way to determine the expected NVPS right now, but it is not that easy to see how it has changed over time and how configuration changes have impacted it. We can add an internal item that will store this value so that we can see long-term changes and graph them. Navigate to Configuration | Hosts, click on Items for A test host, and then click on the Create item button. In this form, start by clicking on Select next to the Key field, and change the Type dropdown to Zabbix internal in the item helper. This presents us with a nice list of the available internal items. We will set up a few of these, but won't discuss every single item in there. If you are curious about some after we are done with this topic, consult the Zabbix manual for detailed information on each internal item. Remember how we created an item to monitor the time when the proxy last contacted the server? That also was an internal item.
In this list, click on zabbix[requiredperformance]. Fill in the following:
- Name:
Expected NVPS - Type: Zabbix internal
- Type of information: Numeric (float)
- Units:
NVPS - New application:
Zabbix performance
When done, click on the Add button at the bottom. Check this item in the Latest data page. After a short while, it should have the value, somewhat similar to what we saw in the Zabbix status report:

This value is likely to be different than the one we saw in the report. We just added an item to monitor the expected NVPS, which provides values of its own, so this action has affected the NVPS already.
With this item configured, let's talk about what it actually is. You might have noticed how it was stressed many times before that this is the expected NVPS. It is based on our host and item configuration and does not actually reflect how many values we are receiving. If we had all the items of the active agent type and all agents were stopped, the expected NVPS would not change, even though we would receive no information at all. Barring such technical issues, this number could differ from the values we normally process because of other reasons. Log-monitoring items are always counted according to their interval. If we have a log item with an interval of 1 second, it is included as 1 NVPS even if the log file itself gets no values—or if it gets 10 values every second. Flexible intervals and item scheduling are ignored, and trapper items are not included in the expected NVPS estimate at all. If we send a lot of values to trapper items, our real, processed NVPS will be higher than the expected NVPS, sometimes several times higher.
As the expected or estimated NVPS can be inaccurate, we also have a way to figure out the real NVPS value—there is another internal item for that purpose. Let's go back to Configuration | Hosts and then Items for A test host again and click on Create item. Fill in the following values:
- Name:
Real NVPS - Type: Zabbix internal
- Key:
zabbix[wcache,values] - Type of information: Numeric (float)
- Units:
NVPS - Store value: Delta (speed per second)
- Applications: Zabbix performance
When done, click on the Add button at the bottom. In the key, we used the keywords wcache and values. The first one is supposed to stand for write cache, or we can think of it as a cache of the values to be written to the database. The values parameter tells it to report the number of values passing through that cache. We will look at other possible parameters a bit later.
Another thing worth noting is the Store value—this internal item reports a counter of all values, and this way, we are getting the number of values per second. We both obtain a value, easily comparable with the expected NVPS, and avoid a hill graph. How would one know which internal items return a final value and which ones are counter items? Consult the Zabbix manual, as usual.
With the item in place, let's compare the expected and real values in the latest data page:
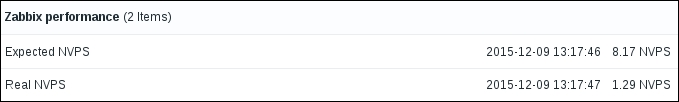
Notice how the expected NVPS value increased again after adding another item.
On this system, parts of the monitoring infrastructure are down, so the real NVPS value is significantly lower than the expected one. You might want to mark the checkboxes next to both of these items and display an ad-hoc graph to visually compare the values and see how they change over time. The expected NVPS is likely to be pretty stable, only changing when the configuration is changed. The real NVPS is likely to go up and down as the value retrieval and processing changes over time.
Let's try to monitor another Zabbix internal item. Go to Configuration | Hosts, click on Items next to A test host, and then click on Create item. Let's monitor the uptime of the Zabbix server—not the whole system, but the Zabbix server daemon. Fill in these values:
- Name:
Zabbix server uptime - Type: Zabbix internal
- Key:
zabbix[uptime] - Units:
uptime
When done, click on Add at the bottom, and then check this item in the Latest data page. Notice how our use of the uptime unit resulted in the raw uptime value in seconds being converted to a human-readable format that shows how long the Zabbix server process has been running for:
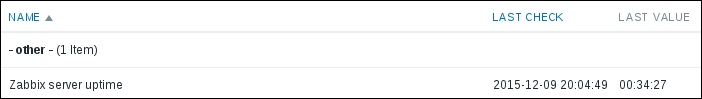
We could display this item in a screen and have a trigger on it to let us know when the Zabbix server was restarted.
We have already discussed several caches in Zabbix and what they are used for. As these caches fill up, it can have different effects on Zabbix. Let's take a look at how we can monitor how much of some of those caches is free or used. We could monitor the free space in the first cache we found out about: the configuration cache. Let's go to Configuration | Hosts, then click on Items next to A test host, and click on Create item. Fill in the following values:
- Name:
Zabbix configuration cache, % free - Type: Zabbix internal
- Key:
zabbix[rcache,buffer,pfree] - Type of information: Numeric (float)
- Units:
%
When done, click on the Add button at the bottom. For this item key, we used the rcache keyword, which stands for read cache. Coupled with buffer, it refers to the configuration cache. With pfree, we are requesting free space in this cache as a percentage. Notice how we're setting Type of information to Numeric (float)—we could have left it at Numeric (unsigned), in which case Zabbix would cut off the decimal part, which is not suggested in this case. Check this item in the Latest data page:
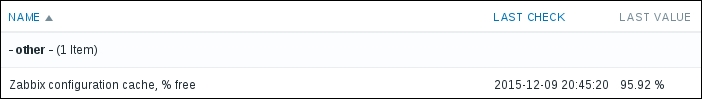
On our system, it is highly unlikely to see the free configuration cache size drop below 90% with the default settings.
There are other internal caches on the server we can monitor. We will discuss what they hold in more detail and the suggested sizes when we look at the daemon configuration parameters a bit later, but let's have a quick list for now:
- Configuration cache: We are monitoring it already. It holds host, item, trigger, and other configuration information
- Value cache: This holds historical values to speed up triggers, calculated items, aggregate items, and other things
- VMware cache: This holds fairly raw VMware data
- History cache and history cache index: These two hold historical values before they are processed for triggers and written to the database
- Trend cache: This holds trend information for the current hour for all items that are receiving values
Note that most of the caches can be monitored for Zabbix proxies, too. This can be done by assigning the host with those items to be monitored by a specific Zabbix proxy. At that point, these internal items will return information about that proxy. Only relevant items will work—for example, monitoring the trend cache on a proxy is not possible simply because there is no trend cache on a proxy. The same approach with having such a host assigned to a proxy works also for the items under the internal process busy rate, which we will discuss next.
Zabbix has a bunch of processes internally, and we have already covered a few—we enabled IPMI and VMware pollers as well as SNMP trappers. For several of these, we were also able to configure how many processes to start. How can we know whether one process is enough or maybe we should have a hundred of them? We will discuss general guidelines per type a bit later, but a very important thing to know is how busy the currently running processes are. There are internal items for this purpose as well. For these items, the general syntax is as follows:
zabbix[process,<type>,<mode>,<state>]
Here, process is a fixed keyword. The second parameter, type, is the process type, as in poller, trapper, and so on. The third parameter, mode, could be one of these:
avg: The average rate across all processes of the specified type.count: The number of processes of the specified type.max: The maximum rate across the processes of the specified type.min: The minimum rate across the processes of the specified type.- A number: The rate for an individual process of the specified type. For example, there are five pollers running by default. With a process number specified here, we could monitor
poller 1orpoller 3. Note that this is the internal process number, not the system PID.
We talked about rate here—this is the amount of time a target process or processes spent in a state, specified by the fourth parameter. It could either be busy or idle.
Should we monitor the busy rate or the idle one? In most cases, the average busy time for all processes of a specific type is monitored. Why busy? Just by convention, when this monitoring got implemented, the first templates monitored the busy rate. Additionally, when debugging a specific issue, it could be helpful to monitor the busy rate for individual processes. Unfortunately, there is no way to query such values directly from the server—we would have to add an item in the frontend and then wait for it to start working. There is no built-in LLD for process types or the number of them—we would have to create such items manually or automate them using XML importing or the Zabbix API.
To see how this works, let's monitor the average busy rate for all poller processes. Go to Configuration | Hosts, click on Items next to A test host, and then on Create item. Fill in these values:
- Name:
Zabbix $4 process $2 rate - Type: Zabbix internal
- Key:
zabbix[process,poller,avg,busy] - Type of information: Numeric (float)
- Units:
% - New application:
Zabbix process busy rates
We used positional variables in the item name again—if we wanted to monitor another process, it would be easy to clone this item and change the process name in the item key only.
When done, click on the Add button at the bottom. Check this item in the Latest data page:
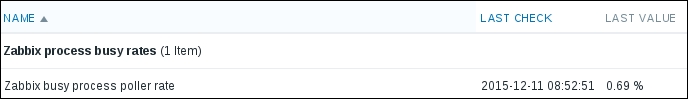
Most likely, our small Zabbix instance is not very busy polling values. By default, there are 5 pollers started, and they are dealing with the current load without any issues.
As an exercise, monitor a few more process types—maybe trapper and unreachable pollers. Check the Zabbix manual section on internal items for the exact process names to be used in this item.
After adding a few more items, you will probably observe that there are a lot of internal processes. We discussed creating such items automatically using XML importing or the API, but then there were also all the caches we could and should monitor. Zabbix tries to help here a bit and ships with default internal monitoring templates. In the search box in the upper-right corner, enter app zabbix and hit the Enter key. Look at the Templates block:
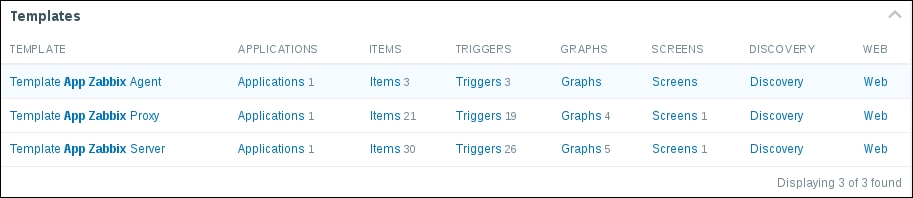
While the agent template is quite simple and not of much interest at this time, the server and proxy templates cover quite a lot, with 31 and 21 items respectively. These templates will allow out-of-the-box monitoring of internal process busy rates, cache usage, queue, values processed, and a few other things. It is highly recommended to use these templates in all Zabbix installations.
These templates might still be missing a few interesting items, such as the expected NVPS item we created earlier. It is suggested to create a separate template with such missing things instead of modifying the default template. Such an approach will allow easier upgrades, as new versions could add more processes, caches, and have other improvements to the default templates. If we leave the default templates intact, we can import a new XML file, tell Zabbix to add all missing things, update existing things, and remove whatever is not in the XML, and we will have an up-to-date default template. If we had it modified...it could be a lot of manual work to update it.
We now know quite a bit about the internal monitoring of Zabbix, but there are still more possibilities. Unsupported items are no good, so let's discuss the ways we could monitor the situation with them.
Similar to cache usage and process busy rates, we may also monitor the count of unsupported items with an internal item. To create such an item, let's go to Configuration | Hosts, click on Items next to A test host, and then click on Create item. Fill in these values:
- Name:
Amount of unsupported items - Type: Zabbix internal
- Key:
zabbix[items_unsupported]
When done, click on the Add button at the bottom. After a short while, check this item on the Latest data page:
58? That is an extremely high value for such a small installation, although in this case it is caused by the VMware monitoring being down. At this time, a VMware timeout results in all VMware items becoming unsupported. In a perfect environment, there would be no unsupported items, so we could create a trigger to alert us whenever this item receives a value larger than 0. That wouldn't be too useful anywhere but in really small environments, though—usually, a thing becomes broken here or there, and the unsupported item count is never 0. A more useful trigger would thus be one that alerts about a larger increase in the number of unsupported items. The change() trigger function could help here:
{A test host:zabbix[items_unsupported].change()}>5Whenever the unsupported item count increases by more than 5 in 30 seconds, which is the default item interval, this trigger will fire. The threshold should be tuned to work best for a particular environment.
Such a global alert will be useful, but in larger environments with more distributed responsibilities, we might want to alert the responsible parties only. One way to do that would be monitoring the unsupported item count per host. With this item, it probably makes most sense to create it in some base template so that it is applied to all the hosts it is needed on. Let's create such an item: navigate to Configuration | Templates, click on Items next to C_Template_Linux, and then click on Create item. Fill in these values:
- Name:
Unsupported item count - Type: Zabbix internal
- Key:
zabbix[host,,items_unsupported]
When done, click on the Add button at the bottom. Check this item on the Latest data page:
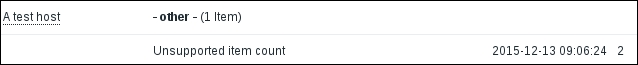
Apparently, the test host has two unsupported items in this installation. We would now create a trigger on the same template, alerting whenever a host has a non-zero count of unsupported items. Such a combination would work fairly well, although in larger installations, it could result in a large number of triggers firing if an item got misconfigured in the template or if a broken userparameter script were distributed. Unfortunately, there is no built-in item to determine the unsupported item count per host group. One workaround would be to use aggregate items, as discussed in Chapter 11, Advanced Item Monitoring. For example, to obtain the unsupported item count for a group called Linux servers, the aggregate item key could look like this:
grpsum[Linux servers,"zabbix[host,,items_unsupported]",last]
We should probably avoid creating a trigger for the unsupported item count on individual hosts, creating one on the aggregate item instead. While the individual items would keep collecting data, which is a bit of a load on the Zabbix server and increases database size, at least the alert count would be reasonable.
Note
If an item turns unsupported, all triggers that reference it stop working, even if they are looking for missing data using the nodata() function. That makes it very hard to alert somebody of such issues unless an internal item such as this is used—it is highly unlikely to become unsupported itself.
There are still more internal items. It is a good idea to look at the full list of available items for the latest version of Zabbix in the online manual.
The items that tell us about the number of unsupported items either for the whole Zabbix installation or for a specific host are useful and tell us when things are not good. But what exactly is not good? There is a very easy way to review the unsupported item list in the frontend. Navigate to Configuration | Hosts, click on any of the Items links, and expand the item filter. Clear out any host, host group, or other filter option that is there, and look at the right-hand side of the filter. In the State dropdown, choose Not supported, and click on Filter. This will display all the unsupported items in this Zabbix instance. Note that we may not display all items in all states like this—the filter will require at least one condition to be set, and the state condition counts.
It is highly recommended to visit this view every now and then and try to fix as many unsupported items as possible. Unsupported items are bad. Note that by default, up to 1,000 entries will be shown. If you have more than 1,000 unsupported items, that's a pretty bad situation and should be fixed.
Tip
In you see unsupported items in templates, it is most likely a Zabbix instance that has been upgraded from an older version. The broken item state was a bug in older versions of Zabbix. To fix this issue, the state for these items should be manually changed in the database. Look up the item ID and set the State value for it to 0. As usual, be very careful with direct database updates.
Alerting on unsupported items, which we covered a moment ago, is likely the best approach, as it allows us to have a small number of triggers and a relatively easy way to split up alerting about them. There's another built-in approach that allows us to alert about unsupported items and triggers in an unknown state—Zabbix has the concept of internal events. To configure an alert based on those internal events, go to Configuration | Actions, choose Internal in the Event source dropdown, and click on Create action. In the Action tab, mark the Recovery message checkbox, and enter these values:
- Name: A trigger changed state to
unknown - Default subject:
{TRIGGER.STATE}: {TRIGGER.NAME} - Recovery subject:
{TRIGGER.STATE}: {TRIGGER.NAME}
Switch to the Conditions tab; in the New condition block, select Event type in the first dropdown, and choose Trigger in "unknown" state in the last dropdown:

Click on the small Add link in the New condition block and switch to the Operations tab. Click on New in the Action operations block, and then click on New in the Send to Users section.
Tip
We set up e-mail for monitoring_user in Chapter 2, Getting Your First Notification—if another user has e-mail properly set up in your Zabbix instance, choose that user instead.
Click on monitoring_user in the popup, and then click on the small Add link in the Operation details block—the last one, just above the buttons at the very bottom. Be careful; this form is very confusing. When done, click on the Add button at the bottom.
We discussed actions in more detail in Chapter 7, Acting upon Monitored Conditions.
Now, whenever a trigger becomes unknown, an alert will be sent.
While we can limit these actions by application, host, template, or host group, we cannot react to internal events in the same actions we use for trigger events. If we already have a lot of actions carefully splitting up notification per host groups, applications, and other conditions, we would have to replicate all of them for internal events to get the same granularity. That is highly impractical, so at this time, it might be best to have a few generic actions, such as ones that inform key responsible persons, who would investigate and pass the issue to the team assigned to that host group, application, or other unit.