
Now that we have seen plenty of ways to monitor all kinds of network devices, it's time to have a look at how we can monitor websites with Zabbix. With Zabbix, it's possible to monitor all kinds of information from web pages. In this recipe, we will explain you how to do it in a few easy steps.
Once again, we need our Zabbix server properly configured with a Zabbix super admin account. Make sure that the agent is installed on the Zabbix server and is working fine.
- Go to Configuration | Hosts and click on the link web after your Zabbix host.
- Click on the Create scenario button on the upper left side of the web page.
- Give as Name for example,
Zabbix availability check. - Create a new Application example,
Zabbix web check. - Keep Update interval, Retries as is and select an agent example, Firefox.
- In the field Variables, put the following data:
{user}=Admin
{password}="your zabbix Admin password"
Step 1: In this recipe, we will add the first step in our scenario to verify the existence of our front page.
- Next click the tab Steps and click the Add button.
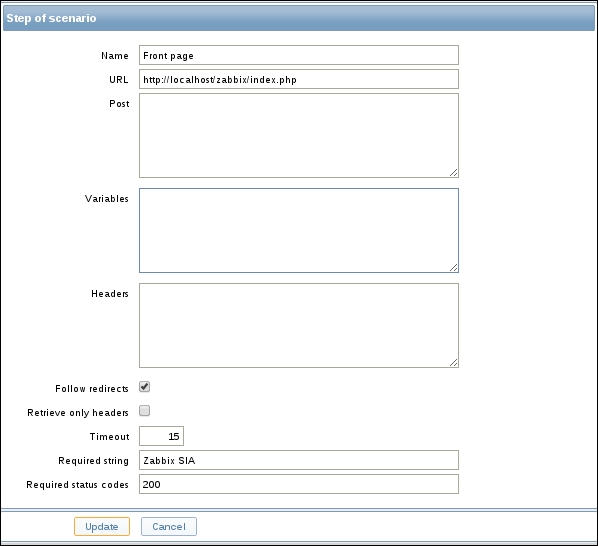
- Give the first step a Name example,
Front page. - Fill in the URL of the Zabbix front page (
http://localhost/zabbix/index.php). - In the box Required string write
Zabbix SIA. - And in the box Required status codes, we put the number
200. - Now you can click the Add button to add our rule to the list:
Step 2: Now we add a second step to login in our Zabbix web page.
- Now we add a new step to our web scenario to monitor if we can login.
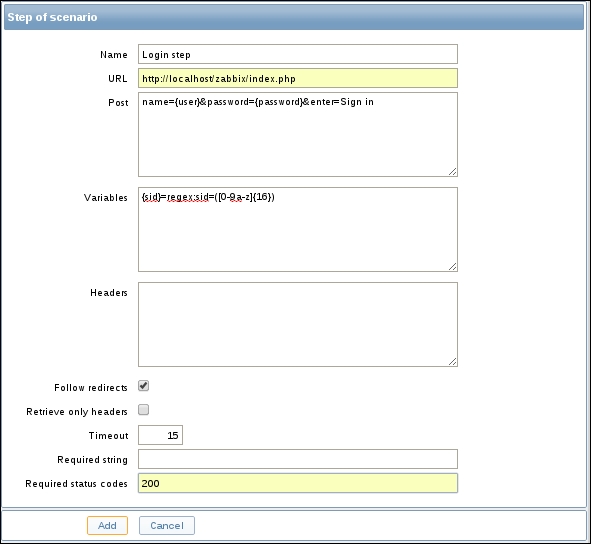
- Give our step a Name example:
Login step. - Add the URL of the Zabbix login page again:
http://localhost/zabbix/index.phpin the URL field. - In the box Post add the following line:
name={user}&password={password}&enter=Sign in - In the box Variables we write add the next line:
{sid}=regex:sid=([0-9a-z]{16}) - And we look again for the Required status codes
200. - Press Add to add the step to our scenario:
Step 3: In our third,step we will verify if the login step that we just made actually works:
- Next, we create yet another step to see if our login actually worked.
- Give the step a Name, example,
Login check. - Once again, fill in the correct URL in the URL field:
http://localhost/zabbix/index.php
- In the field Required string, we put the word
Profile. - And in the Required status code field, we place
200again: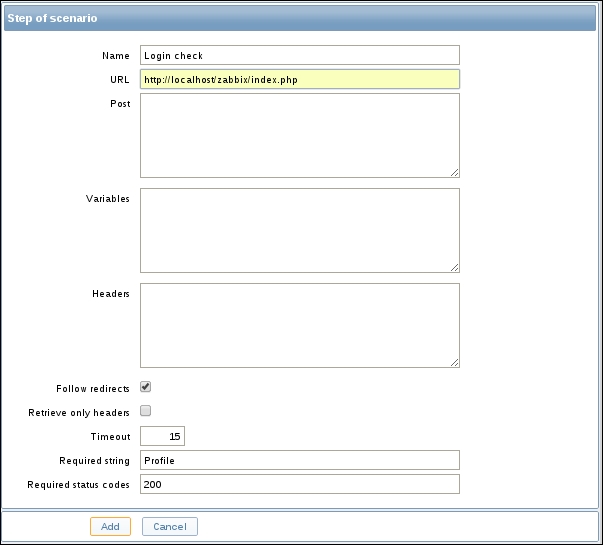
- Press Add to add our third step.
Step 4: In our fourth and last step we will log out of the web page to make sure all sessions are closed.
- For this, we create a new step to see if we can log out.
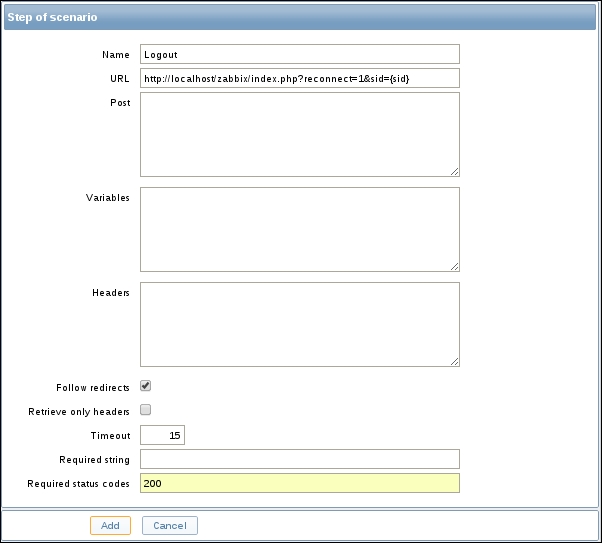
- Give our final step a Name, example,
Logout. - Add the following URL in the
URLfield:http://localhost/zabbix/index.php?reconnect=1&sid={sid} - And fill in the Required status codes of
200. - Press Add button to add our final step to the scenario.
- Make sure now that you save all steps and also the complete scenario in the first tab!
- Go to Monitoring | Web and click on Zabbix Availability Check.
- You will see if everything is fine; a table with Speed, Response time, and Response code for each step and below it, some graphs.
When we want to monitor websites, we have to create a scenario. This scenario is based on a certain level of steps. Each step will be executed in the exact the same order.
In our scenario, we have added some variables for user and password between {} so that we don't have to type our login and password every time in the other steps.
We then added a first step just to monitor the front page; here we filled in the code 200 in the required status codes field. A web server will always return a certain code when we open a web page 200 is the code for OK. More codes can be found here: http://en.wikipedia.org/wiki/List_of_HTTP_status_codes.
We also looked for a required string. This is a unique text on the web page that we see only when we are at the login page of our website.
In the next step, we tried to log in. For this we made use of the post and the variables boxes.
In the post box, we added the string that we need to post with our username and password. Remember we made macros for this. Be careful we have to enter everything in one line and have to glue it together with &. Also, in this example we make use of name and password for name and password but this can change. You have to look in the code of the web page what the exact post variables are. Same goes for the enter=Sign option in, this is the post variable used to enter the username and password.
The variables box is a regular expression that we need because the web page makes use of a session ID. We put our regexp option in a macro {sid} that we can use later.
In our third step, we are already logged in so the only thing to verify if login really worked is add a required string that can only be seen once you are logged in. In our case, that is the word Profile.
Now in our final step, we will try to log out, else all sessions will stay recorded in the database. In some cases it is possible that you can't log in for a certain amount of time because your session is still active.
For this, we have to add the URL that we need to log out and we also have to pass our session ID. Here we can make use of the {sid} macro that we made earlier in step 2.
A few extra tips to keep in mind when you monitor websites:
- If you need to monitor a website that is not running on one of your Zabbix hosts, then the best way to do it is to create a dummy host and use this host to monitor the website.
- It is not possible to skip some steps; if one step fails the scenario will stop.
- There is no support at the moment for JavaScript in Zabbix web monitoring.
- Web monitoring has a hard-coded history of 30 days and a 90 days trend period.
- Since Zabbix 2.4, there is support in steps to follow web page redirects and to retrieve only the headers from web pages.
- Since Zabbix 2.4, it is possible to increase the log level only for a certain process. To debug issues with web monitoring, it can be handy to do this for the HTTP poller.
# zabbix_server -R log_level_increase="http poller"