
A Zabbix item can be understood by its bare essentials—an identifier, data type, and associated host. These are the elements that are generally more useful for the rest of Zabbix's components. The identifier (that's usually the name and the associated item key) and the associated host are used to distinguish a single item among the thousands that can be defined in a monitoring environment. The data type is important so that Zabbix knows how to store the data, how to visualize it (text data won't be graphed, for example), and most importantly, what kind of functions can be applied to it in order to model triggers and the process further.
Two other very important elements that are common to all the items are the history (and trends) retention period and item type. We already saw in Chapter 1, Deploying Zabbix, how history retention directly affects the size of the monitoring database, how to estimate it, and how to strike a balance between the performance and data availability. On the other hand, the item type is essential as it tells Zabbix how the item data is actually going to be made available to the server, which, in other words, means how Zabbix is going to collect the data: through an agent, an SNMP query, an external script, and so on.
As you probably already know, there's a fair number of different item types. While it's fairly easy to understand the difference between an SSH item and an ODBC one, it's also important to understand how the data is passed around between the server and its probes and whether they are a Zabbix agent, a server-side probe, or an external check of some kind. To this end, we'll first concentrate on the Zabbix agent and the difference between a passive item and an active item.
First of all, the active and passive concepts have to be understood from the agent's point of view and not the server's. Furthermore, they serve to illustrate the component that initiates a connection in order to send or receive configuration information and monitor data, as shown in the following diagram:
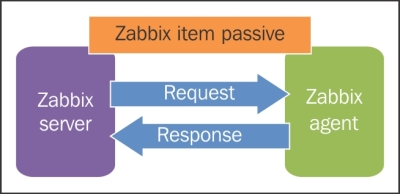
So, a standard Zabbix item is considered passive from the agent's point of view. This means that it's the server's job to ask the agent, at the time intervals defined for the item, to get the desired measurement and report it back immediately. In terms of network operations, a single connection is initiated and brought down by the server while the agent is in the listening mode.
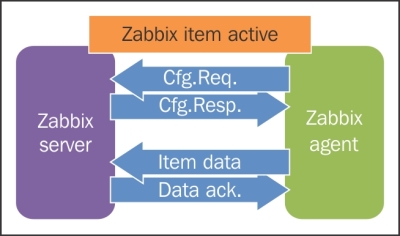
At the other end, in the case of a Zabbix active item, it's the agent's job to ask the server what monitoring data it should gather and at what intervals. It then proceeds to schedule its own measurements and connects back to the server to send them over for further processing. In terms of network operations, the following are the two separate sessions involved in the process:
- The agent asks the server about items and monitoring intervals
- The agent sends the monitoring data it collected to the server
Unlike standard passive items, you'll need to configure an agent so that it knows which server it should connect to for the purpose of configuration and data exchange. This is, of course, defined in the zabbix_agentd.conf file for every agent; just set ServerActive as the hostname or the IP address of your Zabbix server, and set RefreshActiveChecks to the number of seconds the agent should wait before checking whether there are any new or updated active item definitions. The following diagram shows this:
Apart from the network connection initiation, the main difference between a passive item and an active item is that, in the latter, it's impossible to define flexible monitoring intervals. With a passive item, you can define different monitoring intervals based on the time of the day and the day of the week. For example, you could check the availability of an identity management server every minute during office hours and every 10 minutes during the night. On the other hand, if you use an active item, you are stuck with just one option to monitor the intervals.
You may also have noticed a more-than-passive resemblance between the Zabbix active and passive items, and the resemblance between the functionality and features of the Zabbix active and passive proxies.
In fact, you can choose between the active and passive items in much the same way, and for the same reasons you choose between an active or passive proxy in Chapter 2, Distributed Monitoring, to offload some of the server's scheduling jobs and to work around the restrictions and limitations of your network and the routing or firewall configuration.
There is, of course, one main difference between proxies and agents. It's not the fact that a proxy can gather monitoring data from many different hosts, while an agent is theoretically (but not practically, it's certainly possible to stretch its functionality using custom items that rely on scripts or external applications) limited to monitoring just the host it's installed on.
The main difference when it comes to the data flow is that the mode of operation of a proxy is applied to all the hosts and items that the proxy manages. In fact, it doesn't care about the nature of the items a proxy has to monitor. However, when an active proxy gathers its data (whether with active or passive agent items, external scripts, SNMP, SSH, and so on), it will always initiate all connections to the server. The same goes for a passive proxy; it doesn't matter whether all the items it has to monitor are active agent items. It will always wait for the main server for updates on configuration and measurement requests.
On the other hand, an active or passive item is just an item of many. A host can be defined by a mix of active and passive items; so, you can't assume that an agent will always initiate all its connections to the server. To do that, all of the items that rely on the agent have to be defined as active, including the future ones.
An extreme version of an active item that still relies on the Zabbix agent protocol is the Zabbix trapper item. Unique among all other item types, a trapper item does not have a monitoring interval defined at the server level. In other words, a server will know whether a Zabbix trapper item is defined, its data type, the host it's associated with, and the retention period for both history and trends. But it will never schedule a check for the item nor pass the scheduling and monitoring interval information to any proxy or agent. So, it's up to the specific probe to be scheduled in some way and then send the information about the gathered data to the server.
Trapper items are, in some respects, the opposite of Zabbix's external checks from a data flow's point of view. As you probably already know, you define an external check item type when you want the server to execute an external script to gather measurements instead of asking an agent (Zabbix, SNMP, or others). This can exact an unexpected toll on the server's performance as it has to fork a new process for every external script it has to execute and then wait for the response. As the number of external scripts grows, it can significantly slow down the server operations to the point of accumulating a great number of overdue checks while it's busy executing scripts. An extremely simple and primitive, yet effective, way to work around this problem (after reducing the number of external scripts as much as possible, of course) is to convert all external check items to trapper items, schedule the execution of the same scripts used in the external checks through the crontab or any other scheduling facility, and modify the scripts themselves so that they use zabbix_sender to communicate the measured data to the server. When we talk about the Zabbix protocol in Chapter 8, Handling External Scripts, you'll see quite a few examples of this setup.
This is a rundown of item types, classified with the connection type, with a proposed alternative if you want, for any reason, to turn it around. As you can see, Zabbix Trapper is often the only possible, albeit clunky or clumsy, alternative if you absolutely need to reverse a connection type. Note that, in the following table, the term Passive means that the connection is initiated by the server, and Active means that the connection is initiated by whatever probe is used. While this may seem counterintuitive, it's in fact incoherent with the same terms as applied to proxies and agents, as shown in the following table:
|
Item Type |
Direction |
Alternative |
|---|---|---|
|
Zabbix agent |
Passive |
Zabbix agent(active) |
|
Zabbix agent (active) |
Active |
Zabbix agent |
|
Simple check |
Passive |
Zabbix trapper |
|
SNMP agent |
Passive |
Zabbix trapper (SNMP traps are completely different in nature) |
|
SNMP trap |
Active |
N/A |
|
Zabbix internal |
N/A (data about the server monitoring itself) |
N/A |
|
Zabbix trapper |
Active |
Depends on the nature of the monitored data |
|
Zabbix aggregate |
N/A (uses data already available in the database) |
N/A |
|
External check |
Passive |
Zabbix trapper |
|
Database monitor |
Passive |
Zabbix trapper |
|
IPMI agent |
Passive |
Zabbix trapper |
|
SSH agent |
Passive |
Zabbix trapper |
|
TELNET agent |
Passive |
Zabbix trapper |
|
JMX agent |
Passive |
Zabbix trapper |
|
Calculated |
N/A (uses data already in the database) |
N/A |
In the next few paragraphs, we'll dive deeper into some of the more complex and interesting item types.