
We have gained quite comprehensive knowledge of what kind of information we can gather using items. However, so far, we only have a single thing we are actively monitoring—we only have a single trigger created (we did that in Chapter 2, Getting Your First Notification). Triggers can do way more. Let's recap what a trigger is.
A trigger defines when a condition is considered worthy of attention. It "fires" (that is, becomes active), when item data or lack of it matches a particular condition, such as too high system load or too low free disk space.
Let's explore both of these concepts in more detail now. In this chapter, we will:
- Get to know more about the trigger-and-item relationship
- Discover trigger dependencies
- Construct trigger expressions
- Learn about basic management capabilities on the Zabbix frontend with global scripts
Triggers are things that fire. They look at item data and raise a flag when the data does not fit whatever condition has been defined. As we discussed before, simply gathering data is nice, but awfully inadequate. If you want any past historical data gathering, including notifications, there would have to be a person looking at all the data all the time, so we have to define thresholds at which we want the condition to be considered worth looking into. Triggers provide a way to define what those conditions are.
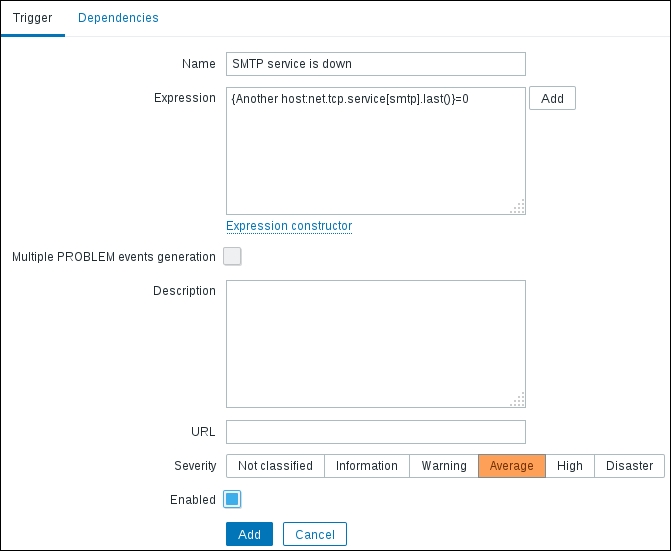
Earlier, we created a single trigger that was checking the system load on A test host. It checks whether the returned value is larger than a defined threshold. Now, let's check for some other possible problems with a server, for example, when a service is down. The SMTP service going down can be significant, so we will try to look for such a thing happening now. Navigate to Configuration | Hosts, click on any of the Triggers links and click on the Create trigger button. In the form that opens, we will fill in some values, as follows:
- Name: The contents of this field will be used to identify the trigger in most places, so it should be human readable. This time, enter
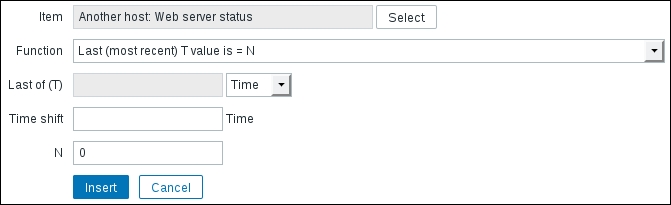
SMTP service is down. Notice how we are describing what the problem actually is. As opposed to an item, which gathers statuses, a trigger has a specific condition to check; thus, the name reflects it. If we have a host that should never have a running SMTP service, we could create a trigger namedSMTP service should not be running. - Expression: This is probably the most important property of a trigger. What is being checked, and for what conditions, will be specified here. Trigger expressions can vary from very simple to complex ones. This time, we will create a simple one, and we will also use some help from the frontend for that. Click on the Add button next to the Expression field to open the expression building dialog. It has several fields to fill in as well, so let's look at what those are:
- Item: Here, we can specify which item data should be checked. To do that, click on the Select button. Another popup will open. Select Linux servers from the Group dropdown, and then select Another host from the Host dropdown. We are interested in the SMTP service, so click on SMTP server status in the NAME column. The popup will close, and the Item field will be populated with the name of the chosen item.
- Function: Here, we can choose the actual test to be performed. Perhaps we can try remembering what the SMTP server status item values were—right,
1was for the server running, and0was for the server being down. If we want to check when the last value was0, the default function Last (most recent) seems to fit quite nicely, so we won't change it. - Last of (T): This is a function parameter if the function supports a time period. We used
180in seconds for our first trigger to check the values during the previous 3 minutes, but when taking the last item value, a time period would make no sense. - Time shift: We will discuss this functionality later in this chapter, in the Relative thresholds or time-shift section.
- N: This field allows us to set the constant used in the previous function. We want to find out whenever an SMTP server goes down (or the status is
0), so here, the default of0fits as well.
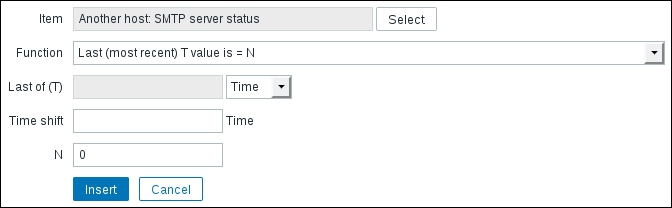
With the values set as illustrated in the previous screenshot, click on the Insert button. The Expression field will now be populated with the
{Another host:net.tcp.service[smtp].last()}=0trigger expression. - Severity: There are five severity levels in Zabbix, and an additional Not classified severity, as shown here:

We will consider this problem to be of average severity, so click on Average:
Before continuing, make sure that the SMTP server is running on Another host, and then click on Add. Let's find out what it looks like in the overview now: go to Monitoring | Overview, and make sure the Type dropdown has Triggers selected. Then, expand the filter, choose Any in the Triggers status dropdown, and click on Filter:
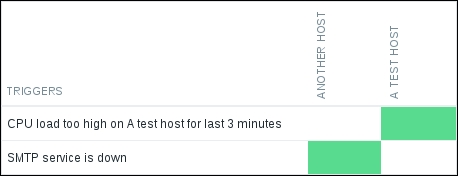
Great, we can see that both hosts now have a trigger defined. Since the triggers differ, we also have two unused cells:
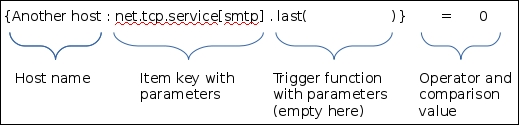
Let's look at the trigger expression in more detail. It starts with an opening curly brace, and the first parameter is the hostname. Separated with a colon is the item key—net.tcp.service[smtp] here. The item key must be replicated exactly as in the item configuration, including any spaces, quotes, and capitalization. After the exact item key comes a dot as a separator, which is followed by the more interesting and trigger-specific thing: the trigger function. Used here is one of the most common functions, last(). It always returns a single value from the item history. There are trigger functions that require at least some parameter to be passed, but for the last() function, this is optional, and if the first parameter is just a number, it is ignored.
On the other hand, if the first parameter is a number prefixed with a hash, it is not ignored. In that case, it works like an nth value specifier. For example, last(#9) would retrieve the 9th most recent value. As we can see, last(#1) is equal to last(0) or last(). Another overlapping function is prev. As the name might suggest, it returns the previous value; thus, prev() is the same as last(#2).
Continuing with the trigger expression, curly braces are closed to represent a string that retrieves some value, that is, host and item reference, followed by the trigger function. Then we have an operator, which in this case is a simple equals sign. The comparison here is done with a constant number, 0.
You might have noticed how items in Zabbix do not contain any configuration on the quality of the data—if the CPU load values arrive, the item does not care whether they are 0 or 500. Any definition of a problem condition happens in a trigger, whether it's a simple threshold or something more complex.
And when we created this trigger, we could click on any of the Triggers links, but we paid attention to the host selected in the dropdowns when choosing the item. It actually does not matter which of those Triggers links we click on, as long as the proper host is selected in that popup or we manually enter the correct hostname.
If we clicked on Triggers for host A and then chose an item from host B for that trigger, the created trigger would not appear for host A, but would appear for host B.
This decoupling of problem conditions from the value collection has quite a lot of benefits. Not only is it easy to check for various different conditions on a single item, a single trigger may also span multiple items. For example, we could check CPU load on a system in comparison with the user session count. If the CPU load is high and there are a lot of users on the system, we could consider that to be a normal situation. But if the CPU load is high while there are a small number of users on the system, it is a problem. An example trigger could be this:
{host:system.cpu.load.last()}>5 and {host:user.sessions.last()}<100This would trigger if CPU load is above 5, but only if there are fewer than 100 users on this system.
A trigger could also reference items from multiple hosts. We could correlate some database statistic with the performance of an application on a different host, or free disk space on file servers with the number of users in Lightweight Directory Access Protocol (LDAP).
We will discuss and configure some slightly more advanced trigger expressions later in this chapter.
We now have one service being watched. There are some more being monitored, and now we can try to create a trigger for an HTTP server. Let's assume that our host runs software that is a bit weird—the web service is a web e-mail frontend, and it goes down whenever the SMTP server is unavailable. This means the web service depends on the SMTP service.
Go to Configuration | Hosts, click on Triggers next to Another host, and then click on Create trigger. Fill in the following values:
- Name:
Web service is down. - Expression: Click on Add, and then again on Select next to the Item field. Make sure Linux servers is selected in the Group dropdown and Another host in the Host dropdown, and then click on Web server status in the NAME column. Both the function and its parameter are fine, so click on Insert:
This inserts the
{Another Host:net.tcp.service[http,,80].last()}=0expression: - Severity: Average
- Description: Trigger expressions can get very complex. Sometimes, the complexity can make it impossible to understand what a trigger is supposed to do without serious dissection. Comments provide a way to help somebody else, or yourself, understand the thinking behind such complex expressions later. While our trigger is still very simple, we might want to explain the reason for the dependency, so enter something such as
Web service goes down if SMTP is inaccessible.
Now, switch to the Dependencies tab. To configure the dependency of the web frontend on the SMTP service, click on the Add link in the Dependencies section. In the resulting window, make sure Linux servers is selected in the Group dropdown and Another host is selected in the Host dropdown, and then click on the only entry in the NAME column: SMTP service is down.
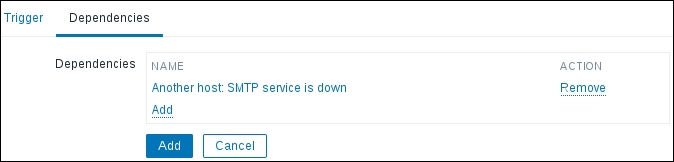
When done, click on the Add button at the bottom. Notice how, in the trigger list, trigger dependencies are listed in the NAME column. This allows a quick overview of any dependent triggers without opening the details of each trigger individually:
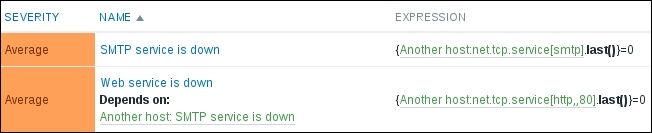
Both triggers in the dependency list and items in the EXPRESSION column act as links, allowing easy access to their details.
With the dependency set up, let's find out whether it changes anything in the frontend. Navigate to Monitoring | Overview, make sure Type is set to Triggers, expand the filter, then switch Triggers status to Any, and click on Filter:
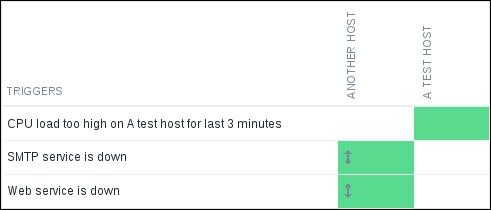
The difference is visible immediately. Triggers involved in the dependency have arrows drawn over them. So, an upward arrow means something depends on this trigger—or was it the other way around? Luckily, you don't have to memorize that. Move the mouse cursor over the SMTP service is down trigger for Another host, the upper cell with the arrow:
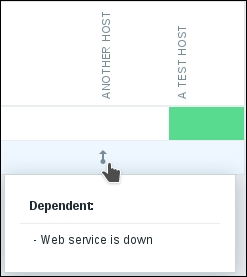
A popup appears, informing us that there are other triggers dependent on this one. Dependent triggers are listed in the popup. Now, move the mouse cursor one cell below, over the downward-pointing arrow:
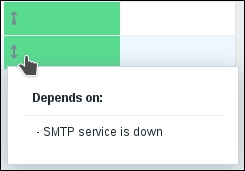
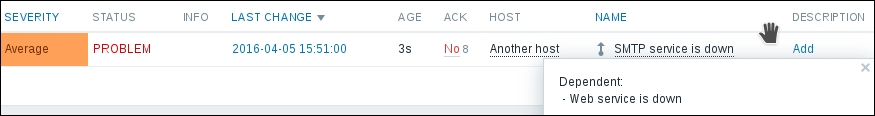
Let's see what effect, other than the arrows, this provides. Go to Monitoring | Triggers, and make sure both Host and Group dropdowns say all. Then, bring down the web server on Another host. Wait for the trigger to fire, and look at the entry. Notice how an arrow indicating dependency is displayed here as well. Move the mouse cursor over it again, and the dependency details will be displayed in a popup:

But what's up with the Show link in the DESCRIPTION column? Let's find out; click on it. The description we provided when creating the trigger is displayed. This allows easy access to descriptions from the trigger list, both for finding out more information about the trigger and updating the description. Click on cancel (![]() ) to return to the trigger list. Now, stop the SMTP service on Another host. Wait for the trigger list to update, and look at it again. The web server trigger has disappeared from the list and is replaced by the SMTP server one. That's because Zabbix does not show dependent triggers if the dependency upstream trigger is in the PROBLEM state. This helps keep the list short and concentrate on the problems that actually cause the downtime.
) to return to the trigger list. Now, stop the SMTP service on Another host. Wait for the trigger list to update, and look at it again. The web server trigger has disappeared from the list and is replaced by the SMTP server one. That's because Zabbix does not show dependent triggers if the dependency upstream trigger is in the PROBLEM state. This helps keep the list short and concentrate on the problems that actually cause the downtime.
Trigger dependencies are not limited to a single level. We will now add another trigger to the mix. Before we do that, we'll also create an item that will provide an easy way to manually change the trigger state without affecting system services. In the frontend, navigate to Configuration | Hosts, click on Items next to Another host, and then click on Create item. Fill in the following values:
- Name:
Testfile exists - Key:
vfs.file.exists[/tmp/testfile]
When you are done, click on the Add button at the bottom. As the key might reveal, this item simply checks whether a particular file exists and returns 1 if it does, and 0 if it does not.
In the bar above the Item list, click on Triggers, and then click on the Create trigger button. Enter these values:
- Name:
Testfile is missing. - Expression: Click on Add and then on Select next to the Item field. In the item list for Another host, click on Testfile exists in the NAME column, and then click on Insert (again, the default function works for us). The Expression field is filled with the following expression:
{Another Host:vfs.file.exists[/tmp/testfile].last()}=0 - Severity: Warning.
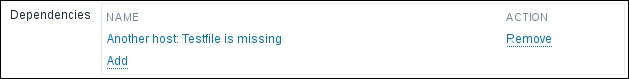
When you are done, click on the Add button at the bottom. Let's complicate the trigger chain a bit now. Click on the SMTP service is down trigger in the NAME column, switch to the Dependencies tab, and click on Add in the Dependencies section. In the upcoming dialog, click on the Testfile is missing entry in the NAME column. This creates a new dependency for the SMTP service trigger:
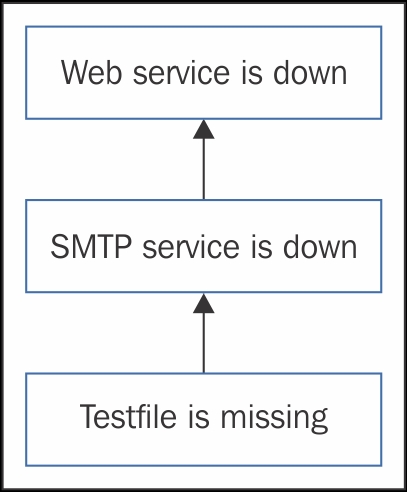
Click on Update. Now, we have created a dependency chain, consisting of three triggers: Web service is down depends on SMTP service is down, which in turn depends on "Testfile is missing". Zabbix calculates chained dependencies, so all upstream dependencies are also taken into account when determining the state of a particular trigger—in this case, "Web service is down" depends on those two other triggers. This means that only a single trigger will be displayed in the Monitoring | Triggers section. If we place the most important trigger at the bottom and the ones depending on it above, we would get a dependency chain like this:
Now, we should get to fixing the problems the monitoring system has identified. Let's start with the one at the top of the dependency chain—the missing file problem. On "Another host", execute this:
$ touch /tmp/testfile
This should deal with the only trigger currently on the trigger list. Wait for the trigger list to update. You will see two triggers, with their statuses flashing. Remember that, by default, Zabbix shows triggers that have recently changed state as flashing, and that also includes triggers in the "OK" state:
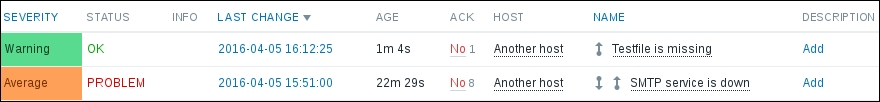
Looking at the list, we can see one large difference this time: the SMTP trigger now has two arrows, one pointing up and the other pointing down. Moving your mouse cursor over them, you will discover that they denote the same thing as before: the triggers that this particular trigger depends on or that depend on this trigger. If a trigger is in the middle of a dependency chain, two arrows will appear, as has happened for the SMTP service is down trigger here.
The arrows here are shown in the same direction as in our previous schematic. We could say that the dependent trigger is "supported" by the "more important" trigger, as if we had bricks placed one on top of another. If any of the bricks disappears, the bricks above it will be in trouble.
Our testfile trigger worked as expected for the chained dependencies, so we can remove that dependency now. Go to Configuration | Hosts, click on Triggers next to Another host, and click on the SMTP service is down trigger in the NAME column. Switch to the Dependencies tab, click on Remove in the ACTION column, and click on the Update button. Note that you always have to save your changes in the editing form of any entity. In this case, simply removing the dependency won't be enough. If we navigate to some other section without explicitly updating the trigger, any modifications will be lost. Now, you can also restart any stopped services on "Another host".
So far, we have used only very simple trigger expressions, comparing the last value to some constant. Fortunately, that's not all that trigger expressions can do. We will now try to create a slightly more complex trigger.
Let's say we have two servers, A test host and Another host, providing a redundant SSH File Transfer Protocol (SFTP) service. We would be interested in any one of the services going down. Navigate to Configuration | Hosts, and click on Triggers next to either A test host or Another host. Then, click on the Create trigger button. Enter these values:
- Name:
One SSH service is down. - Expression: Click on the Add button. In the resulting popup, click on Select next to the Item field. Make sure Another host is selected in the Host dropdown, click on the SSH server status item in the NAME column, and then click on Insert. Now, position the cursor at the end of the inserted expression and enter "
or" without quotes (that's a space,or, and a space). Again, click on the Add button. In the resulting popup, click on Select next to the Item field. Select A test host from the Host dropdown, click on the SSH server status item in the NAME column, and click on Insert. - Severity: Average (remember, these are redundant services).
The final trigger expression should look like this:
{Another host:net.tcp.service[ssh].last()}=0 or {A test host:net.tcp.service[ssh].last()}=0When you are done, click on the Add button at the bottom.
The process we followed here allowed us to create a more complex expression than simply comparing the value of a single item. Instead, two values are compared, and the trigger fires if either of them matches the comparison. That's what the or operator does. Another logical operator is and. Using the SSH server as an example trigger, we could create another trigger that would fire whenever both SSH instances go down. Getting the expression is simple, as we just have to modify that single operator, that is, change or to and, so that the expression looks like this:
{Another host:net.tcp.service[ssh].last()}=0 and {A test host:net.tcp.service[ssh].last()}=0Trigger expressions also support other operators. In all the triggers we created, we used the most common one: the equality operator, =. We could also be using the inequality operator, <>. That would allow us to reverse the expression, like this:
{A test host:net.tcp.service[ssh].last()}<>1While not useful in this case, such a trigger is helpful when the item can have many values and we want the trigger to fire whenever the value isn't the expected one.
Trigger expressions also support the standard mathematical operators +, -, *, and /, and comparison operators <, >, <=, and >=, so complex calculations and comparisons can be used between item data and constants.
Let's create another trigger using a different function. In the frontend section Configuration | Hosts, choose Linux servers from the Group dropdown, click on Triggers next to A test host, and click on the Create trigger button. Then, enter these values:
- Name:
Critical error from SNMP trap - Expression:
{A test host:snmptrap.fallback.str(Critical Error)}=1 - Severity: High
When you are done, click on the Add button at the bottom.
This time, we used another trigger function, str(). It searches for the specified string in the item data and returns 1 if it's found. The match is case sensitive.
This trigger will change to the OK state whenever the last value for the item does not contain the string specified as the parameter. If we want to force this trigger to the OK state manually, we can just send a trap that does not contain the string the trigger is looking for. Sending a success value manually can also be useful when some other system is sending SNMP traps. In a case where the problem trap is received successfully but the resolving trap is lost (because of network connectivity issues, or for any other reason), you might want to use such a fake trap to make the trigger in question go back to the OK state. If using the built-in trap-processing functionality, it would be enough to add trap information to the temporary file. If using the scripted solution with Zabbix trapper items, zabbix_sender could be used. SNMP trap management was discussed in Chapter 4, Monitoring SNMP Devices.
With the service items and triggers we wrote, the triggers would fire right away as soon as the service is detected to be down. This can be undesirable if we know that some service will be down for a moment during an upgrade because of log rotation or backup requirements. We can use a different function to achieve a delayed reaction in such cases. Replacing the function last() with max() allows us to specify a parameter and thus react only when the item values have indicated a problem for some time. For the trigger to fire only when a service has not responded for 5 minutes, we could use an expression such as this:
{A test host:net.tcp.service[ssh].max(300)}=0Remember that for functions that accept seconds as a parameter, we can also use the count of returned values by prefixing the number with #, like this:
{A test host:net.tcp.service[ssh].max(#5)}=0In this case, the trigger would always check the five last-returned values. Such an approach allows the trigger period to scale along in case the item interval is changed, but it should not be used for items that can stop sending in data.
Using trigger functions is the easiest and most-applied solution to potential trigger flapping. The previous service example checked that the maximum value over the last 5 minutes was 0; thus, we were sure that there are no values of 1, which would mean "service is up".
For our CPU load trigger, we used the avg(180) function, checking the average value for the last 3 minutes. We could also have used min(180)—in this case, a single drop below the threshold would reset the 3-minute timer even if the overall average were above the threshold. Which one to use? That is entirely up to you, depending on what the functional requirements are. One way is not always better than the others.
Some items are always expected to provide values, such as the CPU load item. The problem condition for this item usually is "value too large". But there are some items that are different, for example, an item with the agent.ping key. This item only tells us whether the agent is available to the server, and it only returns 1 when the agent is up. And yes, that's it—it does not send 0 when the agent is down; there is no value at all. We can't write a trigger with the last()function, as the last value is always 1. The same goes for min(), max(), and avg(). Luckily, there is a function we can use in this case: nodata(). It allows the trigger to fire if an item is missing data for some period of time. For example, if we created an agent.ping item on "A test host", the trigger could look like this:
{A test host:agent.ping.nodata(300)=1}Here, the nodata() function is checking whether this item is missing data for 300 seconds, or 5 minutes. If so, the trigger will fire. What's the comparison with 1? All trigger functions in Zabbix return some number. The nodata()function returns 1 if the item is missing data and 0 if there's at least one value in the specified time period. Note that it might not be a good idea to try and guess what return values are available for some trigger function—if you are not sure, better check the manual for details at https://www.zabbix.com/documentation/3.0/manual/appendix/triggers/functions.
The nodata()function is said to be time based. "Normal" trigger functions are evaluated when an item receives a new value. This makes a lot of sense for triggers against items such as the CPU load item we created earlier—when a value arrives, we compare it to the threshold. It wouldn't work that well with our agent.ping item, though. If values were coming in, everything would be good—the trigger expression would be evaluated, and this function would return 0. If values stopped coming in, it would not get evaluated and would never fire. Then, if a new value arrived, the function would get evaluated and would see that new value and declare that everything was perfect.
So in this case, the trigger is not evaluated only when a new value comes in. Instead, this function is evaluatede very 30 seconds. This interval is hardcoded. To be more specific, any trigger that includes at least one time-based function in the expression is recalculated every 30 seconds. With the 30-second interval, one should never use a parameter lower than 30 for the nodata() function. To be safe, never use a parameter lower than 60 seconds. In Zabbix version 3.0.0, the following trigger functions are time-based:
date()dayofmonth()dayofweek()nodata()now()time()
Refer to the Zabbix manual if using a later version—there might be changes to this list.
There are systems that send a trap upon failure, but no recovery trap. In such a case, manually resetting every single case isn't an option. Fortunately, we can construct a trigger expression that times out by using the function we just discussed: nodata(). An expression that would make the PROBLEM state time out after 10 minutes looks like this:
{Another host:snmptrap.fallback.str(Critical Error)}=1 and
{Another host:snmptrap.fallback.nodata(600)}=0
For now, we want to have more precise control over how this trigger fires, so we won't change the trigger expression to the previous example's.
Note that adding the nodata() function to a trigger will make that trigger reevaluate every 30 seconds. Doing this with a large amount of triggers can have a significant impact on the performance of the Zabbix server.
There are monitored metrics that have rather different threshold needs depending on the possible range of the value, even when measuring in percentage instead of absolute values. For example, using bytes for a disk-space trigger will not work that well when disks might range from a few dozen megabytes to hundreds of terabytes or even petabytes. Applying our knowledge of trigger expressions, we could vary our threshold depending on the total disk size. For this, we will have to monitor both free and total disk space:
(
    {host:vfs.fs.size[/,total].last()}<=100GB
        and
    {host:vfs.fs.size[/,pfree].last()}<10
) or (
    {host:vfs.fs.size[/,total].last()}>100GB
        and
    {host:vfs.fs.size[/,pfree].last()}<5
)
A trigger that requires item values like this with the last function will only work when all involved items have collected at least one value. In this case, two items are referenced, each twice.
The previous expression has been split for readability. In Zabbix versions before 2.4, it would have to be entered on a single line, but since Zabbix 2.4, newlines and tab characters are supported in trigger expressions.
This expression will make the trigger act differently in two cases of disk configuration:
- Total disk space being less than or equal to 100 GB
- Total disk space being more than 100 GB
Depending on the amount of total disk space, a different threshold is applied to the free disk space in percentage—10% for smaller disks and 5% for larger disks.
One might easily expand this to have different thresholds for disks between 100 MB, 10 GB, 100 GB, 10 TB, and higher.
We discussed hosts and host group maintenance in Chapter 5, Managing Hosts, Users, and Permissions. That allowed us to stop alerting, but when doing so, the smallest entity the maintenance could affect was a host; we could not create a maintenance for a specific trigger. While this is slightly different functionally, we could limit the time for which a trigger is active on the trigger level, too. To do so, we can use several of those time-based trigger functions. Taking our CPU load trigger as an example, we could completely ignore it on Mondays (perhaps there's some heavy reporting done on Mondays?):
{A test host:system.cpu.load.avg(180)}>1 and
{A test host:system.cpu.load.dayofweek()}<>1
The dayofweek() function returns a number with Monday starting at 1, and the previous expression works unless the returned value is 1. We have to append a trigger function to some item even if it does not take item values at all, such as in this case. It is quite counterintuitive seeing the dayofweek() function after the CPU load item, but it's best practice to reuse the same item.
We could also make this trigger ignore weekend mornings instead:
{A test host:system.cpu.load.avg(180)}>1 and
{A test host:system.cpu.load.dayofweek()}>5 and
{A test host:system.cpu.load.time()}<100000
Here, we are checking for the day value to be above 5 (with 6 and 7 being Saturday and Sunday). Additionally, the trigger time()function is being used. This function returns the time in the HH:MM:SS format, so our comparison makes sure it is not 10:00:00 yet.
Note that this method completely prevents the trigger from firing, so we won't get alerts, won't see the trigger on the frontend, and there won't be any events generated.
We will also discuss a way to limit alerts themselves based on time in Chapter 7, Acting upon Monitored Conditions.
Normally, trigger functions look at the latest values—last() gets the last value and min(), max(), and avg()look at the specified time period, counting back from the current moment. For some functions, we may also specify an additional parameter called time shift. This will make the function act as if we had traveled back in time; in other aspects, it will work exactly the same. One feature this allows is creating a trigger with relative thresholds. Instead of a fixed value such as 1, 5, or 10 for a CPU load trigger, we can make it fire if the load has increased compared to a period some time ago:
{A test host:system.cpu.load.avg(3600)} /
{A test host:system.cpu.load.avg(3600,86400)}
>3
In this example, we have modified the time period that we are evaluating—it has been increased to one hour. We have stopped comparing the result with a fixed threshold; instead, we are looking at the average values from some time ago—specifically, 86400 seconds, or one day, ago. Functionally, this expression checks whether the average CPU load for the last hour exceeds the average CPU load for the same hour one day ago more than 3 times.
This way, the CPU load can be 1, 5, or 500—this trigger does not care about the absolute value, just whether it has increased more than thrice.
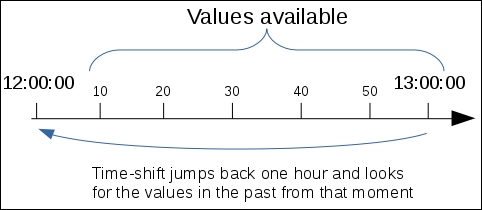
The second parameter for the avg() function we used was the time shift. To understand how it gets the values, let's assume that we have added a new item and the time shift is set to 1 hour. It is 13:00:00 now, and a new value for the item has come in. We had previous values for 1 hour at 12:10:00, 12:20:00, and so on up to 12:50:00. The time shift of one hour would get no values at all, as it would first step 1 hour back to 12:00:00 and then look for all the values 1 hour ago—but the first value we had was at 12:10:00:
As of Zabbix version 3.0.0, the following functions support the time shift parameter:
avg()band()count()delta()last()max()min()percentile()sum()
Zabbix can verify a huge number of things, among which is the current time on monitored systems. Let's create a quick configuration to do just that. We will create an item to collect the current time and then a trigger to compare that time with the current time on the Zabbix server. Of course, for this to work properly, the clock on the Zabbix server must be correct—otherwise, we would complain that it is wrong on all the other systems.
The first thing is the item to collect: the current time. Go to Configuration | Hosts, click on Items next to Another host, and then click on Create item. Fill in the following values:
- Name:
Local time - Key:
system.localtime - Units:
unixtime
When you are done, click on the Add button at the bottom. This item returns the current time as a Unix timestamp. While a unit is not required for our trigger, we entered unixtime there. This will translate the timestamp to a human-readable value in the frontend. We discussed item units in more detail in Chapter 3, Monitoring with Zabbix Agents and Basic Protocols.
In the bar above the item list, click on Triggers, then click on the Create trigger button. Enter these values:
- Name:
Incorrect clock on {HOST.NAME}. - Expression: Click on Add and then on Select next to the Item field. In the item list for Another host, click on Local time in the NAME column and click on Insert. The Expression field is filled with this expression:
{Another host:system.localtime.last()}=0. This isn't actually what we need, but we tried to avoid the function dropdown here, so we will edit the expression manually. Change it to read this:{Another host:system.localtime.fuzzytime(30)}=0. - Severity: Select Warning.
When you're done, click on the Add button at the bottom. The fuzzytime() function accepts a time period as a parameter. This makes it compare the timestamp of the item with the current time on the Zabbix server. If the difference is bigger than the time specified in the parameter, it returns 0, which is the problem condition we wanted to catch. Again, if you are not sure about the return value of some trigger function, better check the Zabbix manual.
Using plain numeric constants is fine while we're dealing with small values. When an item collects data that is larger, such as disk space or network traffic, such an approach becomes very tedious. You have to calculate the desired value, and from looking at it later, it is usually not obvious how large it really is. To help here, Zabbix supports so-called suffix multipliers in expressions—the abbreviations K, M, G, T, and so on are supported. This results in shorter and way more easy-to-read trigger expressions. For example, checking disk space for a host called host looks like this at first:
{host:vfs.fs.size[/,free].last()}<16106127360
With suffix multipliers, it becomes this:
{host:vfs.fs.size[/,free].last()}<15G
This is surely easier to read and modify if such a need arises.
Another type of constant is time based. So far, we've only used time in seconds for all the trigger functions, but that tends to be a bit unreadable. For example, 6 hours would be 21600, and it just gets worse with longer periods. The following time-based suffixes are supported:
s: secondsm: minutesh: hoursd: daysw: weeks
The s suffix would simply be discarded, but all others would work as multipliers. Thus, 21600 would become 6h, which is much more readable. The SSH service trigger example we looked at earlier would also be simpler:
{A test host:net.tcp.service[ssh].max(5m)}=0We have now covered the basics of triggers in Zabbix. There are many more functions allowing the evaluation of various conditions that you will want to use later on. The frontend function selector does not contain all of them, so sometimes you will have to look them up and construct the expression manually. For a full and up-to-date function list, refer to the official documentation at https://www.zabbix.com/documentation/3.0/manual/appendix/triggers/functions.
With all the details explored regarding trigger configuration, we should be able to create powerful definitions on what to consider a problem. There are also several configuration options available to customize the way triggers are displayed.
Navigate to Administration | General and choose Trigger severities in the dropdown in the upper-right corner:
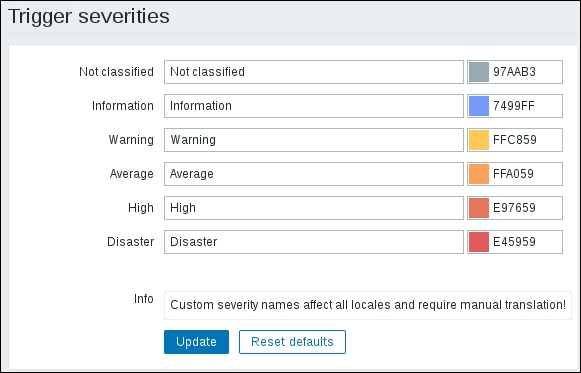
In this section, we may customize severity labels and their colors. As the Info box at the bottom of this page says, changing severity labels will require updating translations that anybody might be using in this Zabbix instance.
Navigate to Administration | General and choose Trigger displaying options in the dropdown in the upper-right corner:
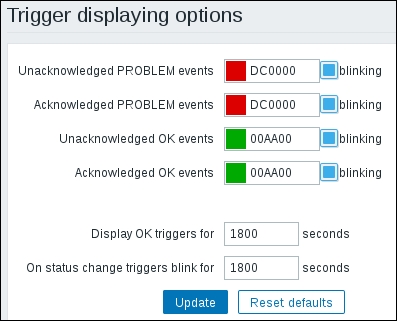
It's not just trigger severity labels that we can modify; we can even change the default red and green colors, used for the PROBLEM/OK states. Even better, the color can be different, depending on whether the problem has been acknowledged or not. We discussed trigger state blinking in Monitoring | Triggers and other frontend sections for 30 minutes. On this page, we can selectively enable or disable blinking based on the trigger state and acknowledgement status, as well as customize the length of time for which a trigger change is considered recent enough to blink—the default can be seen here defined in seconds: 1800.
After we have configured triggers, they generate events, which in turn are acted upon by actions.
Tip
We looked at a high-level schema of information flow inside Zabbix, including item, trigger, and event relationships in Chapter 2, Getting Your First Notification.
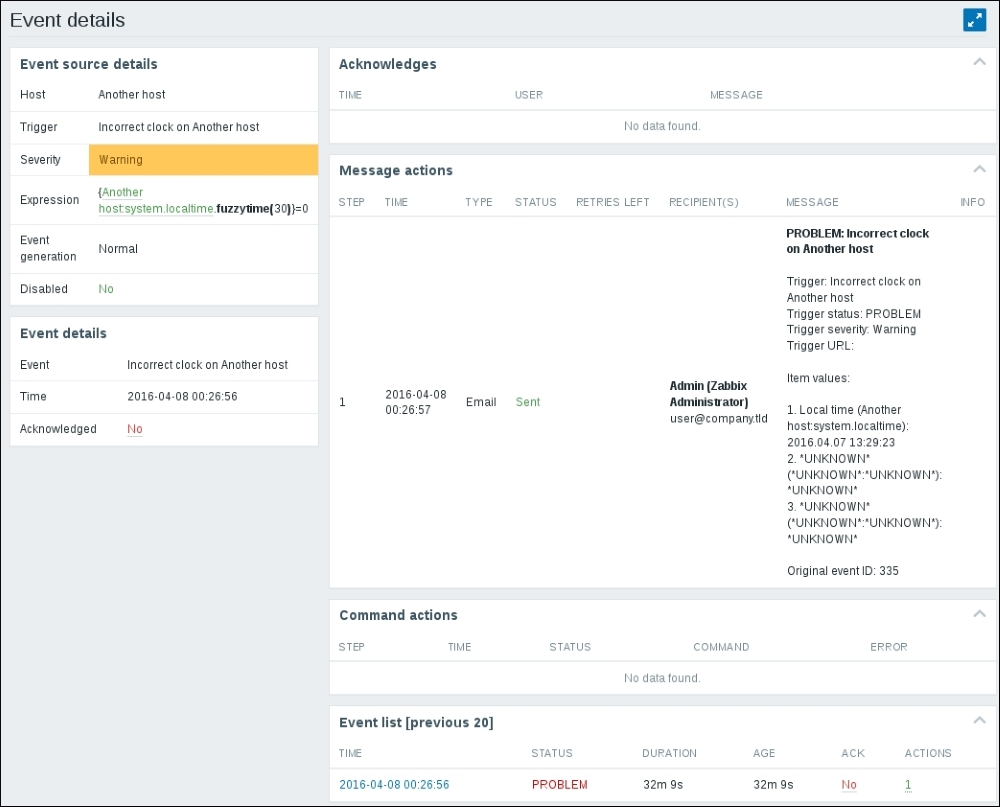
But can we see more details about them somewhere? In the frontend, go to Monitoring | Events, and click on date and time in the TIME column for the latest entry with PROBLEM status.
This opens up the Event details page, which allows us to determine the event flow with more confidence. It includes things such as event and trigger details and action history. The Event list in the lower-right corner, which includes the previous 20 events, itself acts as a control, allowing you to click on any of these events and see the previous 20 events from the chosen event backward in time. As this list only shows events for a single trigger, it is very handy if one needs to figure out the timeline of one, isolated problem:
.
Trigger events are generated whenever a trigger changes state. A trigger can be in one of the following states:
Note
Refer to Chapter 22, Zabbix Maintenance, for information on how to notify about triggers becoming UNKNOWN.
No matter whether the trigger goes from OK to PROBLEM, UNKNOWN, or any other state, an event is generated.
Note
There is also a way to customize this with the Multiple PROBLEM events generation option in the trigger properties. We will discuss this option in Chapter 11, Advanced Item Monitoring.
We found out before that we can use certain trigger functions to avoid changing the trigger state after every change in data. By accepting a time period as a parameter, these functions allow us to react only if a problem has been going on for a while. But what if we would like to be notified as soon as possible, while still avoiding trigger flapping if values fluctuate near our threshold? Here, a specific Zabbix macro (or variable) helps and allows us to construct trigger expressions that have some sort of hysteresis—the remembering of state.
A common case is measuring temperatures. For example, a very simple trigger expression would read like this:
server:temp.last()>20
It would fire when the temperature was 21 and go to the OK state when it's 20. Sometimes, temperature fluctuates around the set threshold value, so the trigger goes on and off all the time. This is undesirable, so an improved expression would look like this:
({TRIGGER.VALUE}=0 and {server:temp.last()}>20) or
({TRIGGER.VALUE}=1 and {server:temp.last()}>15)
A new macro, TRIGGER.VALUE, is used. If the trigger is in the OK state, this macro returns 0; if the trigger is in the PROBLEM state, it returns 1. Using the logical operator or, we are stating that this trigger should change to (or remain at) the PROBLEM state if the trigger is currently in the OK state and the temperature exceeds 20 or when the trigger is currently in the PROBLEM state and the temperature exceeds 15.
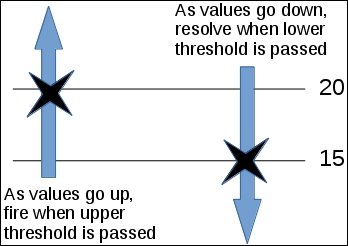
One may also think of this as the trigger having two thresholds—we expect it to switch to the PROBLEM state when the values pass the upper threshold at 20 degrees but resolve only when they fall below the lower threshold at 15 degrees:
How does that change the situation when compared to the simple expression that only checked for temperatures over 20 degrees? Let's have a look:
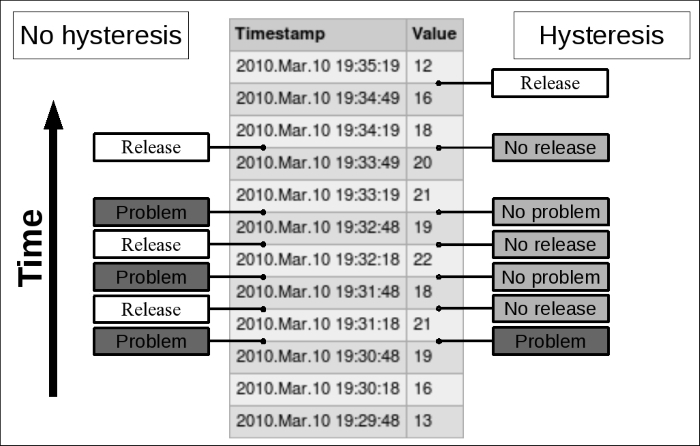
In this example case, we have avoided two unnecessary PROBLEM states, and that usually means at least two notifications as well. This is another way of preventing trigger flapping.