The VIs for this exercise are in Project A.llb. The first example is for DAC (digital-to-analog conversion), where the receiving resolution is much smaller (better) than the sending resolution. This therefore reveals the discrete nature of the output voltage.
The VI for assessing the discrete nature of DAQ operation is Discrete.vi. This VI first sweeps the requested voltage to be sent out in a quasi-continuous manner. The programmed sweep increment size is Max Volts/100. For example, for a sweep range of Max Volts = 10 mV, the sweep increments are 100 μV. However, the output voltage has a resolution of 4880 μV (bipolar).
>
The receiving function is set with high limit and low limit of magnitude 0.1 V. The resolution for receiving is thus 48.8 μV, that is, much less than the the output voltage steps of magnitude 4880 μV.
We will examine, for example, the bipolar mode of the output channels. For this, we need to verify the DAQ configuration for bipolar output. Go to the Start Menu>>Programs>>National Instruments>>Measurements and Automation. (There may be a shortcut for this on the desktop.) Open Devices and Interfaces and then Right Click on the DAQ designator and get Properties.Click on the AO tab and set bipolar.
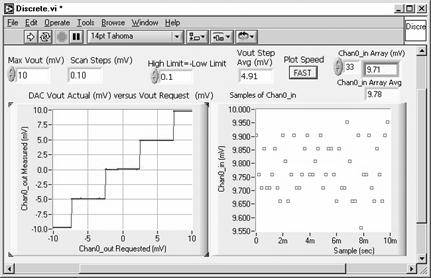
Open Discrete.vi. Verify that Chan0_out is connected directly to Chan0_in on the connector block or circuit board. Verify that in the Front Panel of Discrete.vi, Max Vout is set to 10 mV (for a sweep step size of 100 μV) and that the high limit is set for 0.1 V.
Run the VI. The example of this section illustrates what to expect for the case of the DAQ configured for the bipolar mode. Note that the dc offset of the DAQ has been substracted from the plot, such that the measured voltage appears to be zero volts for zero volts sent out.
A number for the size of the measured steps is indicated [Vout Step Avg (mV)]. It is obtained by the VI as an average of all the steps. The number shown is expected, as it is twice the DAC reference voltage of Vref = 10V divided by 212 or 2Vref/212 = 4.88mV where the exponent is the number of bits of the DAC. The steps are 2.44 mV for a unipolar output configuration.
The graph on the right is a plot of input-channel samples versus sample index. The data illustrate the point scatter due to noise. The noise-free number in the plot at the end of the excution should be 2×4.88 mV = 9.76 mV. Note that the scattered sample points are separated by a discrete value of 48.8 μV. An Array Digital Indicator displays the samples and a Digital Indicator shows the average.
Try other full-range sweep values such as Max Out = 20 mV and 5 mV. With Max Out = 10 mV, go to the Diagram and reset the number of samples from 50 to 500. Re-run and note the increased precision, for example, in Chan0_in Array Avg.