Exercise care when forcing the transistor into the circuit board.
LabVIEW Computations
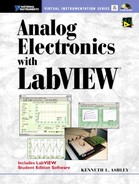
Slope is from curve fit of ln(IC) vs. VBE
Procedure
Diode_IV.vi is used to obtain the current - voltage characteristic for Circuits, B1 and B2. The results will be installed into two Control Graphs of Beta.vi (below). Running Beta.vi then produces values for IC, βDC versus IC, and parameters nF and IS.
Connect Circuit B1. In the Front Panel of Diode_IV.vi, set the value of RE. Run Diode_IV.vi and re-run while resetting Initial Chan 0_out for Min IE of about 0.01 mA. The VI will halt for IE=1 mA or Chan0_out=10 V. Obtain a log of the results. Default the Front Panel to save Initial Chan0_out. It is used in the next circuit.
Connect Circuit B2. Set the value of RB. Run the VI. It will halt for Chan0_out at about 10 V. Obtain a log of the results.
Open Beta.vi. Copy the IE and IB data from the graph (log scale) of Diode_IV.vi and paste the data into the Control Graphs IE (log scale) versus VBE and IB versus VBE, respectively. These data are saved in the log of the Front Panel of Diode_IV.vi. (Reminder: For data copy and paste, Right Click on graph face and Data Operations/Copy or Paste.) Default and saveBeta.vi.
Run the computation VI, Beta.vi. Beta.vi will compute and plot βDC versus IC and indicate parameters nF and IS. Note that the plot uses the values of VBE from the data of IE. An interpolation of the VBE values of IB then is made to find the corresponding IB values.
Beta.vi finds the highest VBE on the low end (for IE or IB) and the smallest VBE on the high end, such that the two plots coincide over the full range of VBE in the combined-plot graph. Note the VBE scale in the right graph of Beta.vi. The computation of NF uses thermal voltage, VT, computed for T = 27°C. At the low currents of the measurements, the device heating is probably negligible and the transistor temperature is probably about 27°C.
Obtain a data file of measured IB and IC for use in a Project B Mathcad file, ProjectB1.mcd. Open IC_IBtoFile.vi (below) from the ProjectB.llb. Copy and paste the plots in the graph on the right side of Beta.vi into the Control Graph of IC_IBtoFile.vi. Write your file path and file name. The file must appear in the folder with the ProjectB1.mcd.
For simulation only, copy and paste the data stored in the log of the Front Panel of Diode_IV.vi. Follow the procedure for Beta.vi above.