A.3. LabVIEW Oscilloscope and Voltmeter (ac)
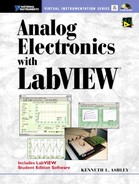
An example of an oscilloscope is shown in Fig. A.14. This special version displays three waveforms. These are the total waveform (ac + D), the sine-wave minus the dc (average value) and the absolute value of the sine-wave (|ac|).
Figure A.14. Front Panel for a possible LabVIEW oscilloscope. Digital Controls provide for inputs of Frequency, Count (number of samples), and #cycles. Digital Indicators show Samples/Sec, Sec/Sample, VDC, and Vac Peak. The limits are set in the Diagram.
The voltmeter is designed to measure peak or RMS values for periodic waveforms, thus, to be an ac voltmeter. Total sampling time must occur in exact multiples of cycles. This provides for obtaining the waveform (sine-wave) peak or RMS value based on an average of all the samples.
The required sample rate, SR, is obtained from
![]()
The values for all the numbers on the right-hand side are set in Digital Controls on the Front Panel (Fig. A.14). The #Samples is also referred to as the Count.
SR and #Samples are then sent to the subVI, AI Acquire Waveform.vi. For example, assume that the #Cycles is 4 and the #Samples is 256. Once cycle will be sampled 64 times. Assume also that f = 1000 Hz. Sample rate SR will be 64000 samples/sec or about 16 μsec/sample. The total sampling time is T · #Cycles, where T is the period and is T = 1/f. In this example this is 4msec.
Digital Indicators in the Front Panel display the dc voltage, VDC, and the peak, Vac Peak. Vac peak is calculated as the average value of |ac| multiplied by π/ 2. The programming sequence for obtaining the three waveforms is shown in Fig. A.15. In the Sequence Frame is also shown the programming configuration for connecting to the graph on the Front Panel and the computation of the peak value, Vac Peak.
Figure A.15. Frame of Sequence Structure showing series of events for obtaining ac peak value. The mean is subtracted from the array with the result converted to the absolute value, and the average is multiplied by π/2.

|
Project PA.5 Observing the Oscilloscope Output Graph |