A.4. Measuring the Discrete Characteristics of Sending and Receiving Voltages
In the discussion above of the autoranging voltmeter, the discrete nature of the ADC and DAC was demonstrated. LabVIEW VIs that plot the input voltage versus output voltages for both ADC and DAC demonstrate the effect further.
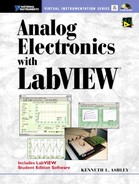
Figure A.16 shows the Front Panel of the VI Discrete.vi. This VI is for demonstrating the discrete nature of the sending and receiving functions. We first consider that of the sending function, as in the case of Discrete.vi in Fig. A.16.
Figure A.16. DAC in the bipolar mode. Plot of the programmed voltage sent out (0.1-mV steps) versus measured actual output voltage. The graph on the right is a plot of the input voltage samples for a single output sweep.

The graph on the left shows the voltage actually sent out (Y-axis) for a quasi-continuous range of requested (programmed) voltage to be sent out (X-axis). In the example, the program called for the output voltage to be swept over a range from –10 to 10 mV in steps of 100 μV. The actual voltage sent out is discrete in steps of 4.88 mV; thus only four steps over the entire range are sent out. The graph on the right is a plot of the input voltage samples from one (the last) measurement. The plot illustrates the inherent scatter in this type of measurement.
In Fig. A.17 is shown the result of measuring a high-resolution output sweep with a less precision input mode of measurement. The high resolution is obtained with a resistance voltage divider. The graph on the left shows the discrete nature of the receiving function for a low-resolution mode. For the limit settings, the receiving resolution is 4.88 mV.
Figure A.17. The full range of the output sweep is 10 mV. (The X-axis is before the 100:1 voltage division.) The input channel has low resolution, as revealed by the steps in the plot.

The transition regions are nonabrupt due, to the bit uncertainty (due to noise) in these regions. In Fig. A.18 is shown input voltage samples (for one output voltage) for a point in a plateau region (a) and for a point in the transition region (b). Note that the plot in the graph on the right in Fig. A.17 is for a plateau region (last point in the sweep in the plot on the left) and shows no scatter.
Figure A.18. (a) Chan0_in samples for a voltage in a plateau region in the plot of Fig. A.17. (b) Samples for a voltage from the transition region.

|
Project PA.7 Discrete Input Voltage from the Circuit Board |