B.8. SPICE BJT βDC as a Function of Collector Current
SPICE calculates a dc beta, βDC, when ISE and NE are included in the transistor model. The equation for the calculation uses βDC = IC/IB, where IB (forward-active mode) includes the ideal and leakage terms, (B.12),

and IC is the collector current for the forward-active mode, (B.7),

Using (B.7) and (B.12) in the definition of βDC, we obtain
Equation B.36

which is
Equation B.37

The VBE variable can be eliminated with
Equation B.38

giving
Equation B.39

where
Equation B.40

and
Equation B.41
![]()
Note that for a given transistor, X is just a collection of parameters and the final result is a relatively simple function of IC if the VAF effect is neglected such that ICo ≈ IC. This is a very good approximation for the project transistors in which VAF is about 200 V and the maximum |VBC| is 3 or 4 V. In the project on the investigation of the βDC dependence on IC, βDC is specifically measured for VBC = 0 (as set automatically by LabVIEW) such that the VAF effect is eliminated.
The form of (B.39) indicates that βDC is an increasing function of collector current, IC. The high-current asymmpote is βF. The simple SPICE model treats βDC as a constant βF, which therefore neglects leakage current. When parameters ISE and NE are included in the transistor model, SPICE uses (B.39) to compute βDC. Note that the circuit solution of Unit B.6 is substantially more complicated if (B.39) is included to account for the variable nature of βDC. The project Mathcad file performs this SPICE solution.
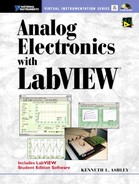
Mathcad-generated plots of collector current and the components of base current (mA) are shown in Fig. B.14. IB1(VBE) is the component with the same exponent as IC (ideal transistor base current) and IB2(VBE) is the leakage component. That is [(B.12)]
Figure B.14. LabVIEW computed plots of IC(mA) and IB(mA) as a function of VBE(V), including components IB1 (ideal) and IB2 (leakage).


The total IB(VBE) is seen to develop at high currents into a plot that is parallel to IC.
The plot was made with numbers that are representative of the transistor of the project in which the parameters are measured. The diode-connected transistor measurements are made for the range 0.01 < IC < 1 mA (–2 < logIC < 1). It is apparent from the plots that the base current for these measurements is made up of a mixture of the two components, or that the base current is in the transition region between leakage-current domination and ideal-current domination.
The pure ideal base current does not develop until IC > 100 mA. This mode cannot be observed experimentally (even if means to avoid heating are implemented, for example, using pulse measurements). Certain high-level effects, which have not been included in the discussion, would come into play at this level, rendering the theories presented here as marginally valid.
An experimental plot of IC/IB = βDC as a function of IC is shown in Fig. B.15. A curve fit to the data yields nE, ISE, and βF(104). We note that the maximum βDC << βF.
Figure B.15. LabVIEW measurement of ratio IC/IB = βDC as a function of IC.