
In the previous section, we saw how to launch Wireshark, and we said that we can open a file that contains packets that we have already captured, and we can start analyzing them using Wireshark. In this section, we want to start sniffing packets and then generate some traffic in our Windows machine, and then we'll see how to analyze these packets using Wireshark. As we know, we first have to be the MITM to use Wireshark, and then the traffic that's generated in the Windows machine and is actually flowing through the eth0 interface, as we saw in the previous section. So, before we start capturing the packets, we need to go to the options by clicking the cog icon:

We can see all the options we can set, all the interfaces that we have, and we can see the traffic generated on them, as shown in the following screenshot:
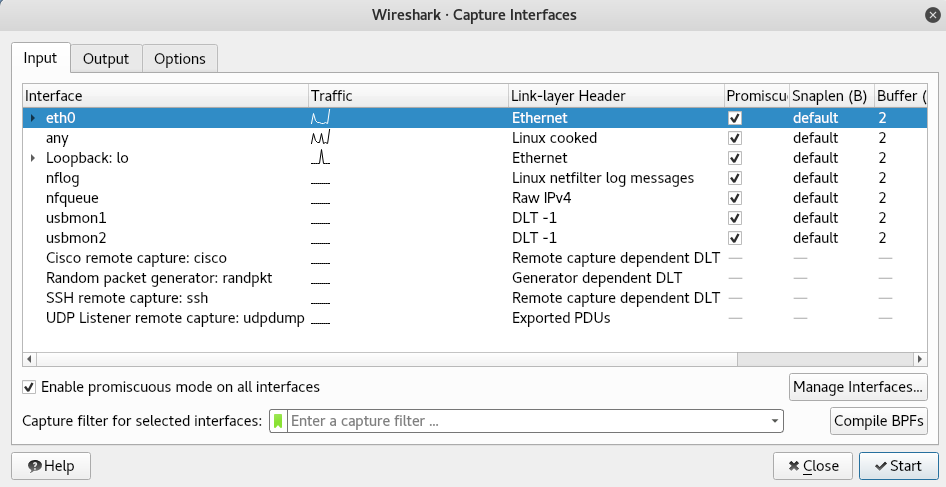
The eth0 interface is generating some traffic every now and then because it's coming from the Windows machine. We can select the interfaces that we want to start capturing on, and we can actually select more than one interface, and all we have to do is just hold the Ctrl key and then click the other interface we have. If we go on the Output tab, we have an option to store the packets:
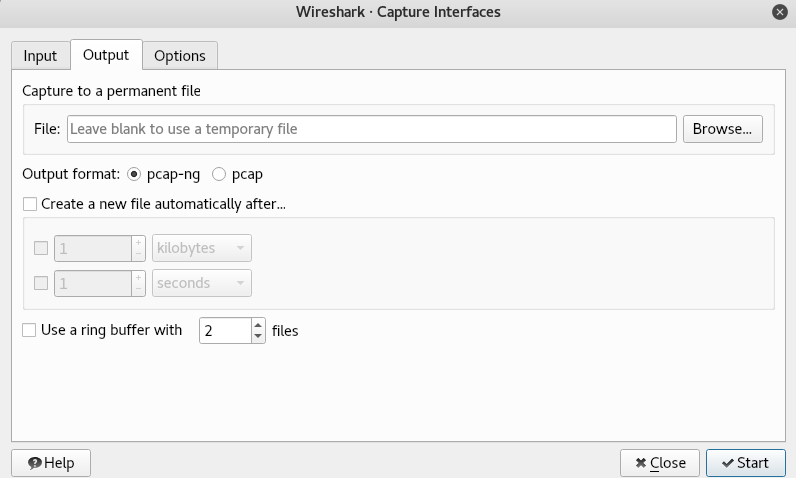
If we only want to sniff and don't want to analyze things, then we can just go to Browse and store the packets that we are going to sniff somewhere, and then we can analyze them whenever we have the time at a different time. We can just open them with Wireshark like we saw in the previous section. We can just go on File | Open and then open the packets and start analyzing them.
Now, we have eth0 selected and we are just going to click on Start, and that'll start capturing packets. Anything that's going to flow through eth0 will be captured and will be displayed in Wireshark:
Anything (we mean images, pictures, messages, cookies) that that computer does on the internet will flow through eth0, and therefore will be captured by Wireshark. It's not like MITMf, which was only showing us the important information. In Wireshark, we will see everything, all the traffic that's generated. So, let's first of all generate some traffic and try to analyze the packets, or the traffic that we generated.
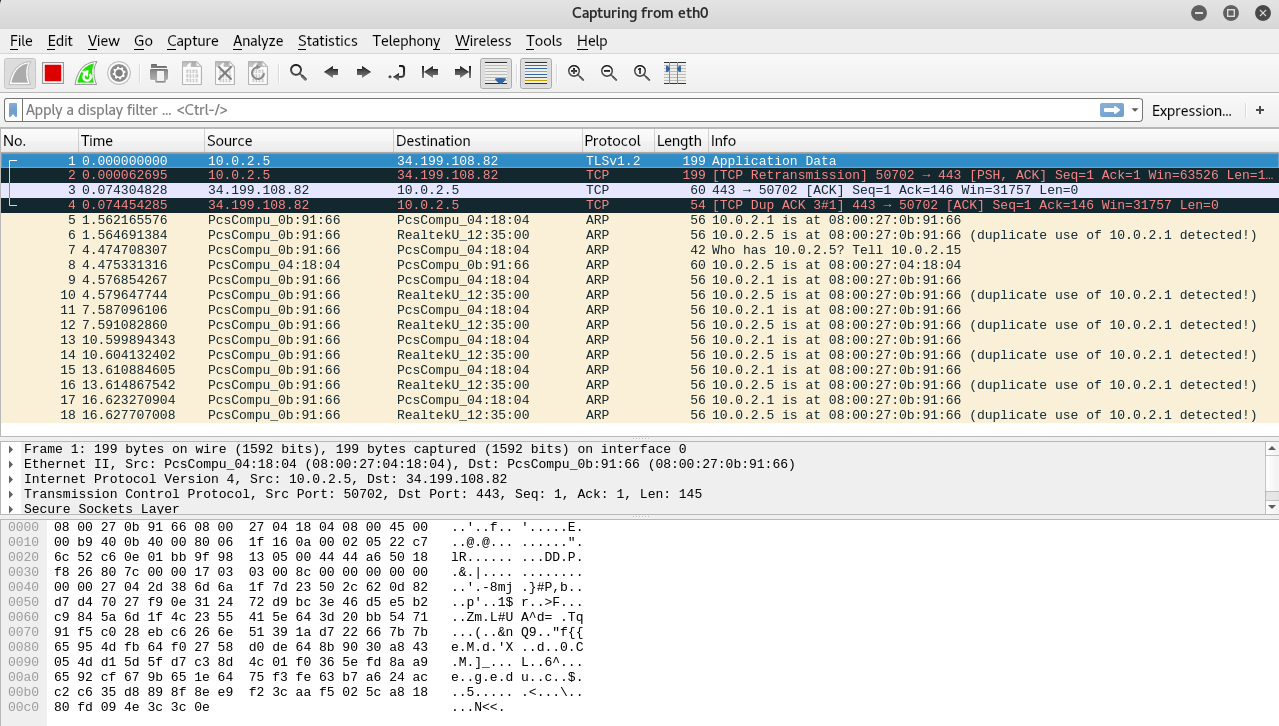
In the main interface of Wireshark, as shown in the following screenshot, we can see that each record is a packet:
We can see the columns. First of all is the No. column for packet numbering. In the Time column, we will see the time that this packet was captured. The time increases as we go down, and it shows when these packets were captured. We can also see the Source column, which indicates which device the packet was sent from. The Destination column shows the receiving device IP. The Protocol column shows the name of the protocol used by the packet. In the Length column we can see the length, which is the size. We can also see more information about the packet in the Info column:
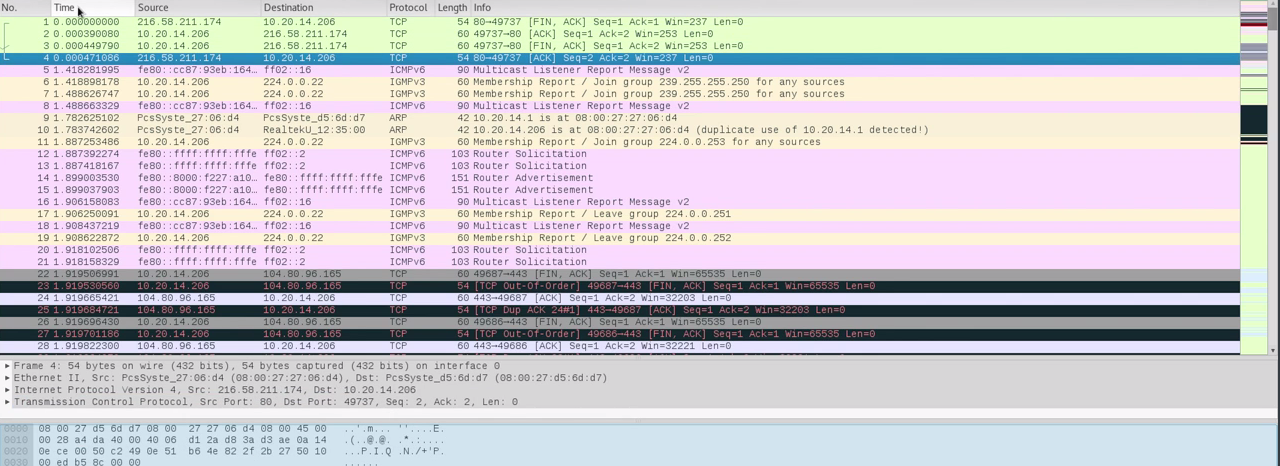
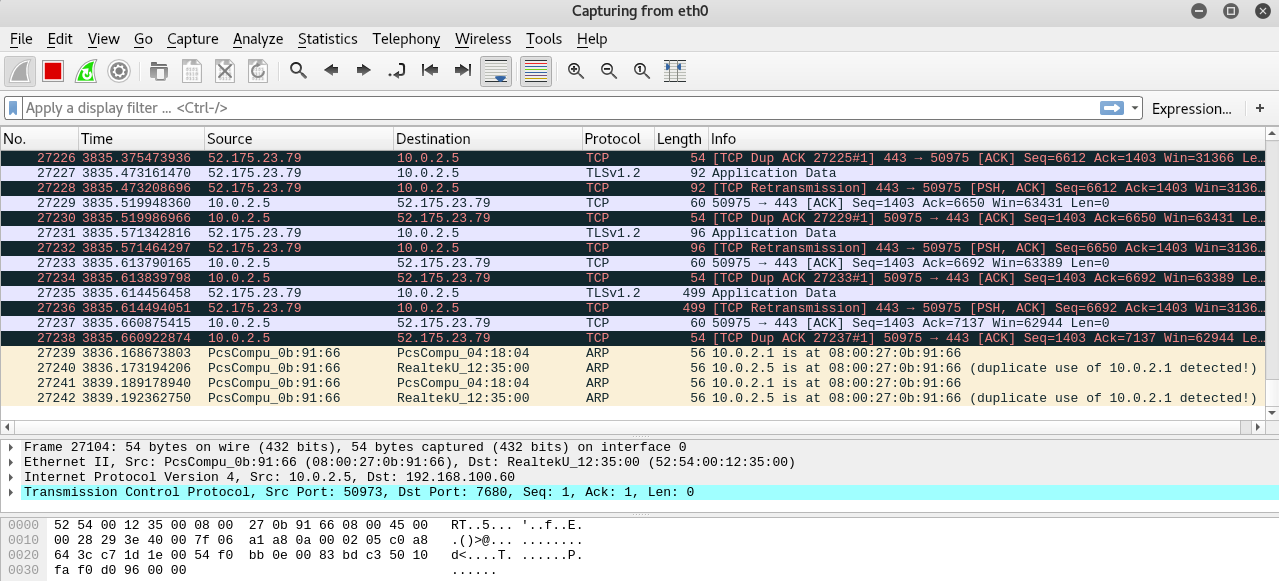
We can also see that packets have different colors. Usually, green is TCP packets and dark blue is DNS packets. Light blue is usually UDP, but we don't have any UDP packets at the moment, and we can also see we have some black packets, and these are TCP packets that had issues. If we double-click on any of the packets, it will display more information for us. It's the same information that's being displayed at the bottom of the main interface. We can see in the following screenshot that we have the Frame, the Ethernet, the Internet Protocol, and the Transmission Control Protocol, and using that we can just click on the arrow and see more information that's stored in here. Now, if we just double-click the packet, we will get the exact same information and we will be able to get information about the packet that we have selected:

Now, most of the traffic that we have generated was HTTP traffic, so to get rid of all this information that's hard for us to read we're just going to type HTTP in the filters, and hit Enter. As we can see, that filtered all the packets to HTTP traffic. So, for example, we have a POST request sent from our target computer to a server. We still don't know what that server is, but it's a server on the internet. When we double-click that, we'll get more information about this packet. We're going to make this smaller here. So, under Frame we can see the interface that's used. We can see information about the packet itself. In Ethernet II, as we can see in the following screenshot, is the information about the Destination and the Source, so we can see that the MAC address is used. In the Internet Protocol, we will see information such as the geolocation of the target, wherein we will see where that packet is sent. In the Transmission, we can see information about the ports used:
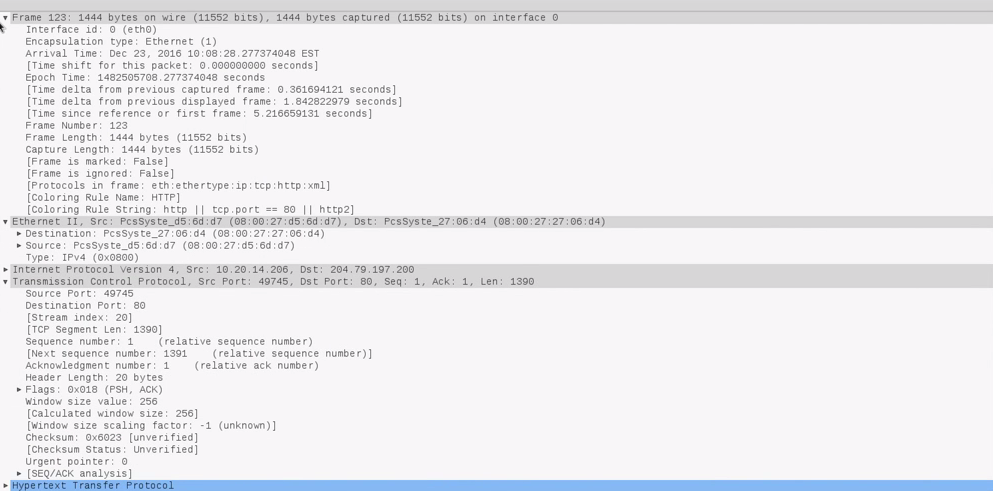
Now, a really interesting part for us is the Hypertext Transfer Protocol, as this is where we really see the interesting information. In here, we can see that the request was sent to bing.com, and we will see that this request was searching for www, and we can see that the Content Type was text. So, we can get this information, as we can see in the following screenshot, about each packet that's sent, and can see that Wireshark logs everything that happens. It doesn't only show the interesting information, it literally logs everything. It contains the interesting stuff plus much more:

So, again, we can see all the searches that we did. We can see all the URLs that the user has entered so far. If we scroll down, we will be able to see all the other URLs that we visited.