ROS has a good number of tools which allow the user and the developer to visualize and debug their code in order to detect and solve issues with both hardware and software. This comprises a message logging system similar to log4cxx, diagnostic messages, and also visualization and inspection tools, which provide a comprehensive list of the running nodes as well as how are they interconnected.
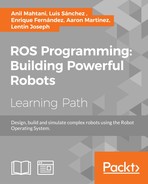
In this chapter, we will also show you how to debug an ROS node with the GDB debugger. The message logging API will be explained, and advice will be given on how to choose the logging level. Then, we will explain the set of ROS tools that allows us to inspect which processes are running and what information is communicated between them. For instance, the following figure shows a tool that visualizes the graph of the system, where the nodes are the processes running and the edges represent the data workflow through communication topics. This tool is rqt_graph, and in this case, it shows the nodes and topics which compose the REEM robot software system running on a Gazebo simulation.
You can see multiple controllers for the arms, torso, head, MoveIt! move_group node, pick and place action servers, and the play_motion node for pre-recorded movements. Other nodes publish joint_states, spawn the robot controllers, and control the joystick to move the mobile base.
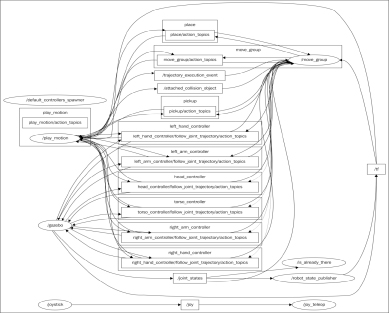
Similarly, this chapter will show you how to plot scalar data in a time series, visualize images from a video stream, and represent different types of data in a 3D representation using (the widely known) rviz (or rqt_rviz), as shown in the following screenshot:
The preceding screenshot shows the REEM robot, which can be run in simulation with the following command:
$ roslaunch reem_2dnav_gazebo reem_navigation.launch
Note that before you install it, you need to follow the instructions provided at http://wiki.ros.org/Robots/REEM. The following sections in this chapter will cover the following topics on visualization and debugging: debugging our code in ROS; using logging messages in our code, with different severity levels, names, conditions, and throttling options. Here, we will explain the rqt_logger_level and rqt_console interfaces, which allow you to set the severity level of a node and visualize the message, respectively. We will also inspect the state of the ROS system by listing the nodes running, the topics, services, and actions they use to transfer messages among them, and the parameters declared in the ROS master server. We will explain rqt_graph, which shows nodes and topics in a directed graph representation, and rqt_reconfigure, which allows you to change dynamic parameters. We will also take a look at visualizing diagnostics information using the untime_monitor and robot_monitor interfaces, as well as plotting scalar data from messages using rqt_plot.
For non-scalar data, we will explain other rqt tools available in ROS, such as rqt_image_view to visualize images and rqt_rviz to show multiple data in a 3D representation. We will also show you how to visualize markers and interactive markers, and what frames are and how they are integrated into ROS messages and visualization tools. We will also explain how to use rqt_tf_tree to visualize the Transform Frame (tf) tree, along with how to save messages and replay them for simulation or evaluation purposes. We will also cover the rqt_bag interface.
Finally, other rqt_gui interfaces will be explained, as well as how to arrange them in a single GUI.
Most of the rqt tools can be run by simply inputting their name in the terminal, such as rqt_console, but in some cases this does not work and we must use rosrun rqt_reconfigure rqt_reconfigure, which always works; note that the name seems to be repeated, but it is actually the package and node names, one after the other.