Scalar data can be plotted as a time series over the time provided by the timestamps of the messages. Then, in the y axis, we can plot our scalar data. The tool for doing so is rqt_plot. It has a powerful argument syntax, which allows you to specify several fields of a structured message in a concise manner; we can also add or remove topics or fields manually from the GUI.
To show rqt_plot in action, we are going to use the example4 node, as it publishes a scalar and a vector (non-scalar) in two different topics, which are temp and accel, respectively. The values put in these messages are synthetically generated, so they have no actual meaning, but they are useful for our plotting demonstration purposes. Start by running the node using the following command:
$ rosrun chapter3_tutorials example4
To plot a message, we must know its format; use rosmg show <msg type> if you do not know it. In the case of scalar data, we always have a data field that has the actual value. Hence, for the temp topic, which is of the Int32 type, we will run the following command:
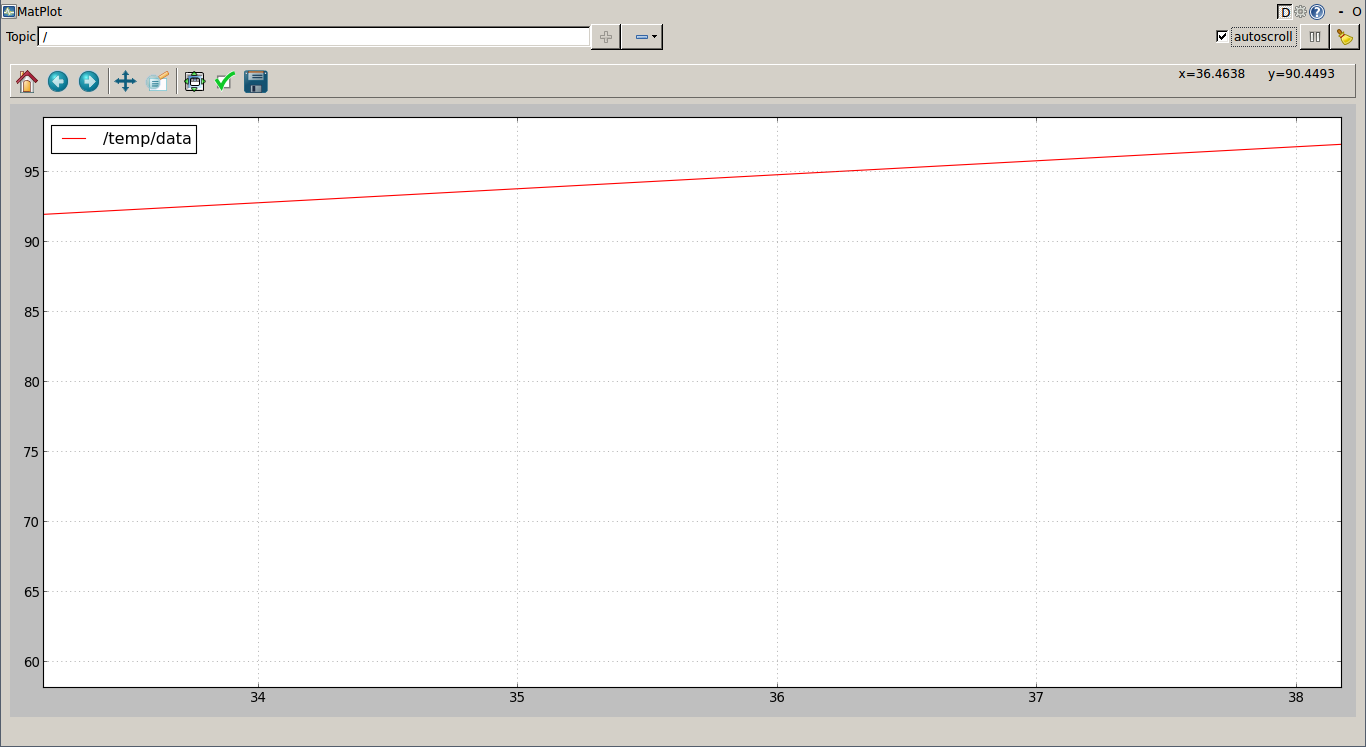
$ rosrun rqt_plot rqt_plot /temp/data
With the node running, we will see a plot that changes over time with the incoming messages, as shown in the following screenshot:
For accel, we have a Vector3 message (as you can check with rostopic type /accel), which contains three fields that we can visualize in a single plot. The Vector3 message has the x, y, and z fields. We can specify the fields separated by colons (:) or in the more concise manner, as shown in the following command:
$ rosrun rqt_plot rqt_plot /accel/x:y:z
The plot should look similar to the one in the following screenshot:

We can also plot each field in a separate axis. However, rqt_plot does not support this directly. Instead, we must use rqt_gui and arrange three plots manually, as shown in the following command and the screenshot after that:
$ rosrun rqt_gui rqt_gui

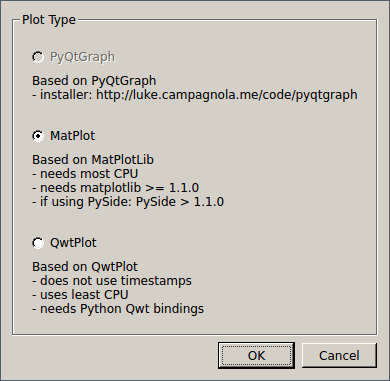
The rqt_plot GUI supports three plotting frontends. We can use QT frontends, which are faster and support more time series simultaneously. You can access and select them from the configuration button: