
ROS provides a series of tools to manage logging messages. In ROS Kinetic, we have two separate GUIs: rqt_logger_level to set the logging level of the nodes or named loggers and rqt_console to visualize, filter, and analyze the logging messages.
In order to test this, we are going to use example3. Run roscore and rqt_console to see the logging messages:
$ rosrun rqt_console rqt_console
The following window will open:

Now, run the node:
$ rosrun chapter3_tutorials example3
You will start seeing the logging messages, as the following screenshot shows. Note that roscore must be running and that you must press the recording button on rqt_console.
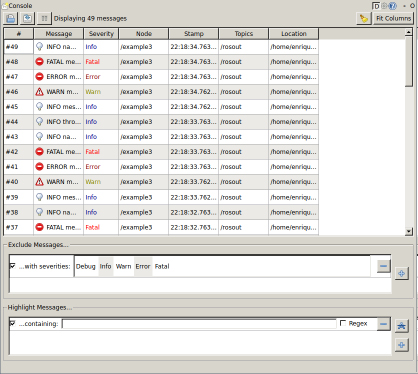
In rqt_console, the messages are collected and shown in a table where different columns separate the timestamp, the message itself, the severity level, and the node that produced the message, alongside other information. You can fit the columns automatically by pressing the Resize columns button. If you double-click on a message, you can see all the information, including the line of code that generated it, as shown in the following screenshot:
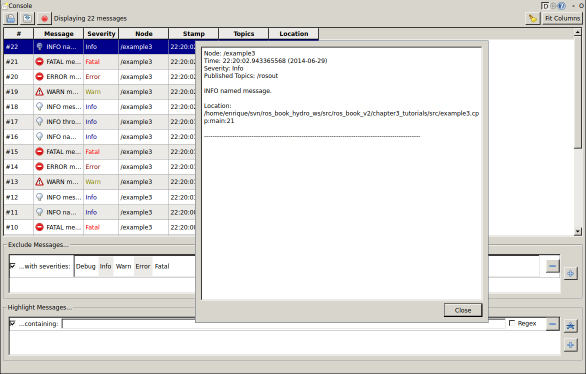
This interface allows you to pause, save, and load previous/saved logging messages. We can clear the list of messages and filter them. In ROS Kinetic, excluding those that are filtered, messages have specific interfaces depending on the filter criteria. For instance, nodes can be filtered with a single rule, where we select the nodes we want to exclude. Additionally, in the same way, we can set highlighting filters. This is shown in the following screenshot:

As an example, the messages from the previous image are filtered by excluding those with a severity different to Error and Fatal.
In order to set the severity of the loggers, we must run the following command:
$ rosrun rqt_logger_level rqt_logger_level
Here, we can select the node, then the named logger, and finally its severity. Once we modify it, the new messages received with a severity below the desired level will not appear in rqt_console:
Shown in the following screenshot is an example where we have set the severity level to the minimum (Debug) for the named logger, ros.chapter3_tutorials.named_msg, of the example3 node; remember that the named loggers are created by the *_NAMED logging functions
As you can see, every node has several internal loggers by default, which are related to the ROS communication API, among others; in general, you should not reduce their severity.