
6.11. NICHOLS CHART USING MATLAB [7]
In the previous section, the Nichols chart was illustrated. We superimposed a hand-drawn plot of the open-loop transfer function G(s)H(s) on a pre-drawn and supplied Nichols chart. In this section, the MATLAB utility used for obtaining the Nichols chart is identified, and the reader will be shown how to obtain the Nichols chart very easily and accurately using MATLAB. The control-system engineer does not have to go and find a pre-drawn Nichols chart when using MATLAB. The Nichols chart and the superimposed plot of G(s)H(s) are both created and drawn at the same time.
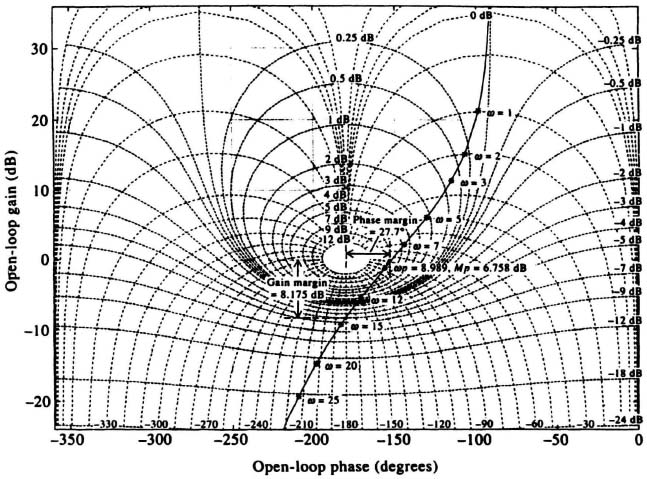
Figure 6.51(a) Nichols chart for the system shown in Figure 6.49.
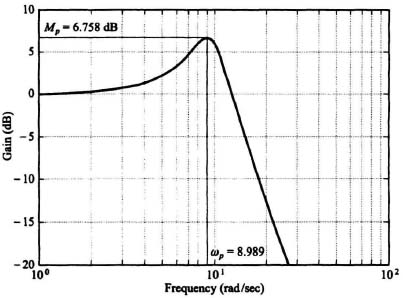
Figure 6.51(b) Closed-loop frequency response of the system shown in Figure 6.49 from the Nichols chart of Figure 6.51a.
The MATLAB Control System Toolbox uses the command nichols to create the Nichols frequency response plot, and it uses the command ngrid to generate the grid lines for a Nichols chart. The MCSTD Toolbox simplifies the process with the comman nichgrid.
The definition of the nichgrid command is as follows:
function[x,y] = nichgrid(g,a,b,n)
where
g = grid values for axis (in degrees and dB)
a = angles (in degrees, − 180° < a < 0)
b = gains (in dB)
n = interpolation value (optional, default = none)
x = phase values
y = magnitude (in dB).
The MCSTD Toolbox [38] discusses the command nichgrid in great detail.
Let us consider drawing the Nichols chart for a unity-feedback control system whose open-loop transfer function is given by
For purposes of MATLAB formulation, we will put this transfer function in the following format:
The resulting MATLAB program is shown in Table 6.20 which develops the Nichols chart and also superimposes this transfer function. Comments made previously in Section 6.8 on the use of MATLAB for the Bode diagram shown in the MATLAB Program Table 6.8 apply here too. This illustration is contained in DEMO 3 in the MCSTD Toolbox.
The resulting Nichols chart obtained from this program is plotted in Figure 6.52.