10.3 Graphs of y = a sin( bx + c) and y = a cos(bx + c)
Phase Angle • Displacement • Graphs of and • Cycle
In the function c represents the phase angle. It is another very important quantity in graphing the sine and cosine functions. Its meaning is illustrated in the following example.
EXAMPLE 1 Sketch function with phase angle
Sketch the graph of
Here, Therefore, in order to obtain values for the table, we assume a value for x, multiply it by 2, add to this value, and then find the sine of the result. The values shown are those for which 2, and so on, which are the important values for
| x | 0 | |||||||||
| y | 0 | 0.7 | 1 | 0.7 | 0 | 0 | 0.7 |
Solving we get which gives The other values for y are found in the same way. See Fig. 10.13.

Fig. 10.13
Note from Example 1 that the graph of is precisely the same as the graph of except that it is shifted units to the left. In Fig. 10.14, a calculator view shows the graphs of and We see that the shapes are the same except that the graph of is units to the left of the graph of
In general, the effect of c in the equation is to shift the curve of to the left if or shift the curve to the right if The amount of this shift is given by Due to its importance in sketching curves, the quantity is called the displacement (or phase shift).
We can see the reason that the displacement is by noting corresponding points on the graphs of and For when then For when then The point on the graph of is units horizontally from the point (0, 0) on the graph of In Fig. 10.14,
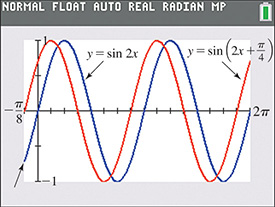
Fig. 10.14
Therefore, we use the displacement combined with the amplitude and the period along with the other information from the previous sections to sketch curves of the functions and where
By use of these quantities and the one-fourth period distance, the graphs of the sine and cosine functions can be readily sketched.
A general illustration of the graph of is shown in Fig. 10.15.
CAUTION
Note that the displacement is negative (to the left) for and positive (to the right) for as shown in Figs. 10.15(a) and (b), respectively.
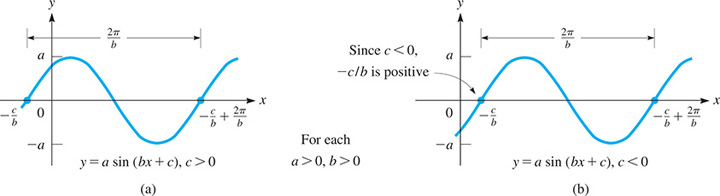
Fig. 10.15
NOTE
[Note also that we can find the displacement for the graphs of by solving for x. We see that ]
This is the same as the horizontal shift for graphs of functions that is shown on page 105.
EXAMPLE 2 Sketching graph of y = a sin(bx + c)
Sketch the graph of
First, note that and Therefore, the amplitude is 2, the period is and the displacement is (We can also get the displacement from )
Note that the curve “starts” at and starts repeating units to the right of this point. Be sure to grasp this point well. The period tells us the number of units along the x-axis between such corresponding points. One-fourth of the period is
Important values are at and so on. We now make the table of important values and sketch the graph shown in Fig. 10.16.
| x | 0 | ||||||
| y | 0 | 0 | 2 | 0 | 0 |

Fig. 10.16
EXAMPLE 3 Sketching graph of y = a cos(bx + c)
Sketch the graph of the function
First, we determine that
the amplitude is 1
the period is
the displacement is
We now make a table of important values, noting that the curve starts repeating units to the right of
| x | |||||
| y | 0 | 1 | 0 |
From this table, we sketch the graph in Fig. 10.17.
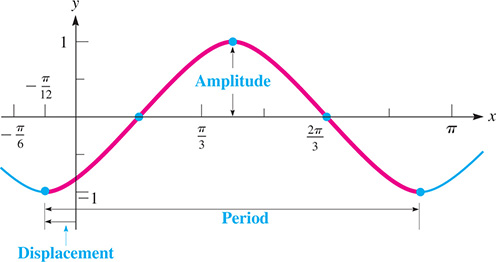
Fig. 10.17
Each of the heavy portions of the graphs in Figs. 10.16 and 10.17 is called a cycle of the curve. A cycle is any section of the graph that includes exactly one period.
EXAMPLE 4 Graph on calculator
View the graph of on a calculator.
From the values and we determine that
the amplitude is 2
the period is
the displacement is
This curve’s cycle starts at and ends at When choosing the window settings, we should make sure these two values are between the Xmin and Xmax. The amplitude determines the Ymin and Ymax. The graph is shown in Fig. 10.18.
![A curve oscillates about y = 0 on a screen that is [negative 1, 14] by [negative 2, 2].](http://imgdetail.ebookreading.net/202009/01/9780136747826/9780136747826__basic-technical-mathematics__9780136747826__images__Fig10-18.jpg)
Fig. 10.18
Example 5 Phase angle—ac voltage/current lead and lag
In alternating-current (ac) circuits, voltage (v) and current (i) can both be represented by sine waves with the same period. Depending on the existence of resistors, capacitors, or inductors in the circuit, these waves can be in phase (maximums and minimums occur at the same time) or one can lead or lag the other. See Fig. 10.19.
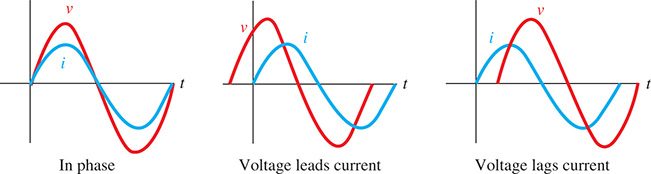
Fig. 10.19
If we assume that the sine wave for current passes through the origin, it can be represented as where f is the frequency (in cycles/s) and t is time (in s). The voltage can then be represented by where is the phase angle.
NOTE
[The phase angle, often written in degrees, tells us how many degrees (assuming 360° is one complete cycle) the voltage leads (if is positive) or lags (if is negative) the current by.]
For example, if and then voltage leads current by , or one-quarter of the period. See Fig. 10.20. It is somewhat unusual that the voltage function combines radians and degrees , but this is commonly done in this particular application. If we convert the phase angle to radians, we can then find the displacement, which gives the time shift in seconds between the two waves:
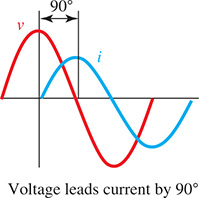
Fig. 10.20
Therefore, voltage leads current by This is one-quarter of the period, with the period equal to
NOTE
[Note that in order to graph the voltage function on a calculator, the phase angle must be expressed in radians.]
Exercises 10.3
In Exercises 1 and 2, graph the function if the given changes are made in the indicated examples of this section.
In Example 3, if the sign before is changed, sketch the graph of the resulting function.
In Example 4, if the sign before is changed, sketch the graph of the resulting function.
In Exercises 3–26, determine the amplitude, period, and displacement for each function. Then sketch the graphs of the functions. Check each using a calculator.
In Exercises 27–30, write the equation for the given function with the given amplitude, period, and displacement, respectively. [Hint: Use Eqs. (10.1) to determine a, b, and c.]
sine, 4,
cosine, 8,
cosine, 12, 1/2, 1/8
sine, 18, 4,
In Exercises 31 and 32, show that the given equations are identities. The method using a calculator is indicated in Exercise 31.
By viewing the graphs of and show that
Show that
In Exercises 33–40, solve the given problems.
 What conclusion do you draw from the calculator graphs of
- What conclusion do you draw from the calculator graphs of
The current in an alternating-current circuit is given by Find a function for the voltage v if the amplitude is 18V and voltage lags current by . Then find the displacement. See Example 5.
The current in an alternating-current circuit is given by Find a function for the voltage v if the amplitude is 28V and voltage leads current by . Then find the displacement. See Example 5.
A wave traveling in a string may be represented by the equation Here, A is the amplitude, t is the time the wave has traveled, x is the distance from the origin, T is the time required for the wave to travel one wavelength (the Greek letter lambda). Sketch three cycles of the wave for which and
The electric current i (in ) in a certain circuit is given by where t is the time in seconds. Sketch three cycles of this function.
39. A certain satellite circles Earth such that its distance y, in miles north or south (altitude is not considered) from the equator, is where t is the time (in min) after launch. Use a calculator to graph two cycles of the curve.
- In performing a test on a patient, a medical technician used an ultrasonic signal given by the equation Use a calculator to view two cycles of the graph of I vs. t if and Explain how you chose your calculator’s window settings.
In Exercises 41–44, give the specific form of the equation by evaluating a, b, and c through an inspection of the given curve. Explain how a, b, and c are found.
-
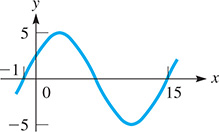
Fig. 10.21
-
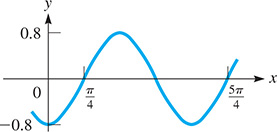
Fig. 10.22