 22 Introduction to Statistics
by Allyn J. Washington,
Richard Evans
Basic Technical Mathematics, 11th Edition
22 Introduction to Statistics
by Allyn J. Washington,
Richard Evans
Basic Technical Mathematics, 11th Edition
- Basic Technical Mathematics
- Contents
- Preface
- BASIC CURVES
- MyMathLab
- 1 Basic Algebraic Operations
- LEARNING OUTCOMES
- 1.1 Numbers
- 1.2 Fundamental Operations of Algebra
- 1.3 Calculators and Approximate Numbers
- 1.4 Exponents and Unit Conversions
- 1.5 Scientific Notation
- 1.6 Roots and Radicals
- 1.7 Addition and Subtraction of Algebraic Expressions
- 1.8 Multiplication of Algebraic Expressions
- 1.9 Division of Algebraic Expressions
- 1.10 Solving Equations
- 1.11 Formulas and Literal Equations
- 1.12 Applied Word Problems
- CHAPTER 1 KEY FORMULAS AND EQUATIONS
- CHAPTER 1 REVIEW EXERCISES
- CHAPTER 1 PRACTICE TEST
- 2 Geometry
- 3 Functions and Graphs
- 4 The Trigonometric Functions
- 5 Systems of Linear Equations; Determinants
- LEARNING OUTCOMES
- 5.1 Linear Equations and Graphs of Linear Functions
- 5.2 Systems of Equations and Graphical Solutions
- 5.3 Solving Systems of Two Linear Equations in Two Unknowns Algebraically Solving Systems of Two Linear Equations in Two Unknowns Algebraically
- 5.4 Solving Systems of Two Linear Equations in Two Unknowns by Determinants Solving Systems of Two Linear Equations in Two Unknowns by Determinants
- 5.5 Solving Systems of Three Linear Equations in Three Unknowns Algebraically Solving Systems of Three Linear Equations in Three Unknowns Algebraically
- 5.6 Solving Systems of Three Linear Equations in Three Unknowns by Determinants Solving Systems of Three Linear Equations in Three Unknowns by Determinants
- CHAPTER 5 KEY FORMULAS AND EQUATIONS
- CHAPTER 5 REVIEW EXERCISES
- CHAPTER 5 PRACTICE TEST
- 6 Factoring and Fractions Factoring and Fractions
- LEARNING OUTCOMES
- 6.1 Factoring: Greatest Common Factor and Difference of Squares Factoring: Greatest Common Factor and Difference of Squares
- 6.2 Factoring Trinomials
- 6.3 The Sum and Difference of Cubes
- 6.4 Equivalent Fractions
- 6.5 Multiplication and Division of Fractions
- 6.6 Addition and Subtraction of Fractions
- 6.7 Equations Involving Fractions
- CHAPTER 6 KEY FORMULAS AND EQUATIONS
- CHAPTER 6 REVIEW EXERCISES
- CHAPTER 6 PRACTICE TEST
- 7 Quadratic Equations
- 8 Trigonometric Functions of Any Angle
- 9 Vectors and Oblique Triangles
- 10 Graphs of the Trigonometric Functions
- LEARNING OUTCOMES
- 10.1 Graphs of y = a sin x and y = a cos x Graphs of y = a sin x and y = a cos x
- 10.2 Graphs of y = a sin bx and y = a cos bx Graphs of y = a sin bx and y = a cos bx
- 10.3 Graphs of y = a sin( bx + c) and y = a cos(bx + c) Graphs of y = a sin( bx + c) and y = a cos(bx + c)
- 10.4 Graphs of y = tan x , y = cot x , y = sec x , y =
- 10.5 Applications of the Trigonometric Graphs
- 10.6 Composite Trigonometric Curves
- CHAPTER 10 KEY FORMULAS AND EQUATIONS
- CHAPTER 10 REVIEW EXERCISES
- CHAPTER 10 PRACTICE TEST
- 11 Exponents and Radicals
- LEARNING OUTCOMES
- 11.1 Simplifying Expressions with Integer Exponents
- 11.2 Fractional Exponents
- 11.3 Simplest Radical Form
- 11.4 Addition and Subtraction of Radicals
- 11.5 Multiplication and Division of Radicals
- CHAPTER 11 KEY FORMULAS AND EQUATIONS
- CHAPTER 11 REVIEW EXERCISES
- CHAPTER 11 PRACTICE TEST
- 12 Complex Numbers
- LEARNING OUTCOMES
- 12.1 Basic Definitions
- 12.2 Basic Operations with Complex Numbers
- 12.3 Graphical Representation of Complex Numbers
- 12.4 Polar Form of a Complex Number
- 12.5 Exponential Form of a Complex Number
- 12.6 Products, Quotients, Powers, and Roots of Complex Numbers Products, Quotients, Powers, and Roots of Complex Numbers
- 12.7 An Application to Alternating-current (ac) Circuits
- CHAPTER 12 KEY FORMULAS AND EQUATIONS
- CHAPTER 12 REVIEW EXERCISES
- CHAPTER 12 PRACTICE TEST
- 13 Exponential and Logarithmic Functions
- LEARNING OUTCOMES
- 13.1 Exponential Functions
- 13.2 Logarithmic Functions
- 13.3 Properties of Logarithms
- 13.4 Logarithms to the Base 10
- 13.5 Natural Logarithms
- 13.6 Exponential and Logarithmic Equations
- 13.7 Graphs on Logarithmic and Semilogarithmic Paper
- CHAPTER 13 KEY FORMULAS AND EQUATIONS
- CHAPTER 13 REVIEW EXERCISES
- CHAPTER 13 PRACTICE TEST
- 14 Additional Types of Equations and Systems of Equations Additional Types of Equations and Systems of Equations
- 15 Equations of Higher Degree
- 16 Matrices; Systems of Linear Equations
- LEARNING OUTCOMES
- 16.1 Matrices: Definitions and Basic Operations
- 16.2 Multiplication of Matrices
- 16.3 Finding the Inverse of a Matrix
- 16.4 Matrices and Linear Equations
- 16.5 Gaussian Elimination
- 16.6 Higher-order Determinants
- CHAPTER 16 KEY FORMULAS AND EQUATIONS
- CHAPTER 16 REVIEW EXERCISES
- CHAPTER 16 PRACTICE TEST
- 17 Inequalities
- LEARNING OUTCOMES
- 17.1 Properties of Inequalities
- 17.2 Solving Linear Inequalities
- 17.3 Solving Nonlinear Inequalities
- 17.4 Inequalities Involving Absolute Values
- 17.5 Graphical Solution of Inequalities with Two Variables
- 17.6 Linear Programming
- CHAPTER 17 KEY FORMULAS AND EQUATIONS
- CHAPTER 17 REVIEW EXERCISES
- CHAPTER 17 PRACTICE TEST
- 18 Variation
- 19 Sequences and the Binomial Theorem
- 20 Additional Topics in Trigonometry
- LEARNING OUTCOMES
- 20.1 Fundamental Trigonometric Identities
- 20.2 The Sum and Difference Formulas
- 20.3 Double-Angle Formulas
- 20.4 Half-Angle Formulas
- 20.5 Solving Trigonometric Equations
- 20.6 The Inverse Trigonometric Functions
- CHAPTER 20 KEY FORMULAS AND EQUATIONS
- CHAPTER 20 REVIEW EXERCISES
- CHAPTER 20 PRACTICE TEST
- 21 Plane Analytic Geometry
- LEARNING OUTCOMES
- 21.1 Basic Definitions
- 21.2 The Straight Line
- 21.3 The Circle
- 21.4 The Parabola
- 21.5 The Ellipse
- 21.6 The Hyperbola
- 21.7 Translation of Axes
- 21.8 The Second-degree Equation
- 21.9 Rotation of Axes
- 21.10 Polar Coordinates
- 21.11 Curves in Polar Coordinates
- CHAPTER 21 KEY FORMULAS AND EQUATIONS
- CHAPTER 21 REVIEW EXERCISES
- CHAPTER 21 PRACTICE TEST
- 22 Introduction to Statistics
- LEARNING OUTCOMES
- 22.1 Graphical Displays of Data
- 22.2 Measures of Central Tendency
- 22.3 Standard Deviation
- 22.4 Normal Distributions
- 22.5 Statistical Process Control
- 22.6 Linear Regression
- 22.7 Nonlinear Regression
- CHAPTER 22 KEY FORMULAS AND EQUATIONS
- CHAPTER 22 REVIEW EXERCISES
- CHAPTER 22 PRACTICE TEST
- APPENDIX A Solving Word Problems
- APPENDIX B Units of Measurement
- Photo Credits
- Answers to Odd-Numbered Exercises and Chapter Review Exercises
- Exercises 1.1, page 5
- Exercises 1.2, page 10
- Exercises 1.3, page 16
- Exercises 1.4, page 22
- Exercises 1.5, page 26
- Exercises 1.6, page 28
- Exercises 1.7, page 33
- Exercises 1.8, page 35
- Exercises 1.9, page 38
- Exercises 1.10, page 42
- Exercises 1.11, page 44
- Exercises 1.12, page 48
- Review Exercises for Chapter 1, page 50
- Exercises 2.1, page 57
- Exercises 2.2, page 63
- Exercises 2.3, page 67
- Exercises 2.4, page 70
- Exercises 2.5, page 75
- Exercises 2.6, page 78
- Review Exercises for Chapter 2, page 81
- Exercises 3.1, page 88
- Exercises 3.2, page 92
- Exercises 3.3, page 95
- Exercises 3.4, page 100
- Exercises 3.5, page 106
- Exercises 3.6, page 109
- Review Exercises for Chapter 3, page 110
- Review Exercises for Chapter 4, page 135
- Exercises 5.1, page 146
- Exercises 5.2, page 150
- Exercises 5.3, page 157
- Exercises 5.4, Page 163
- Exercises 5.5, page 167
- Exercises 5.6, page 173
- Review Exercises for Chapter 5, page 175
- Exercises 6.1, page 185
- Exercises 6.2, page 192
- Exercises 6.3, page 194
- Exercises 6.4, page 198
- Exercises 6.5, page 203
- Exercises 6.6, page 208
- Exercises 6.7, page 213
- Review Exercises for Chapter 6, page 215
- Exercises 7.1, page 224
- Exercises 7.2, page 227
- Exercises 7.3, page 230
- Exercises 7.4, page 235
- Review Exercises for Chapter 7, page 237
- Exercises 8.1, page 243
- Exercises 8.2, page 248
- Exercises 8.3, page 252
- Exercises 8.4, page 257
- Review Exercises for Chapter 8, page 260
- Exercises 9.1, page 267
- Exercises 9.2, page 270
- Exercises 9.3, page 276
- Exercises 9.4, page 281
- Exercises 9.5, page 288
- Exercises 9.6, page 293
- Review Exercises for Chapter 9, page 295
- Exercises 10.1, page 302
- Exercises 10.2, page 305
- Exercises 10.3, page 309
- Exercises 10.4, page 312
- Exercises 10.5, page 314
- Exercises 10.6, page 318
- Review Exercises for Chapter 10, page 320
- Exercises 11.1, page 327
- Exercises 11.2, page 331
- Exercises 11.3, page 335
- Exercises 11.4, page 338
- Exercises 11.5, page 341
- Review Exercises for Chapter 11, page 343
- Exercises 12.1, page 348
- Exercises 12.2, page 351
- Exercises 12.3, page 353
- Exercises 12.4, page 356
- Exercises 12.5, page 358
- Exercises 12.6, page 363
- Exercises 12.7, page 369
- Review Exercises for Chapter 12, page 371
- Exercises 13.1, page 375
- Exercises 13.2, page 379
- Exercises 13.3, page 384
- Exercises 13.4, page 387
- Exercises 13.5, page 390
- Exercises 13.6, page 394
- Exercises 13.7, page 398
- Review Exercises for Chapter 13, page 400
- Exercises 14.1, page 406
- Exercises 14.2, page 409
- Exercises 14.3, page 413
- Exercises 14.4, page 417
- Review Exercises for Chapter 14, page 418
- Exercises 15.1, page 425
- Exercises 15.2, page 430
- Exercises 15.3, page 435
- Review Exercises for Chapter 15, page 436
- Exercises 16.1, page 443
- Exercises 16.2, page 447
- Exercises 16.3, page 452
- Exercises 16.4, page 456
- Exercises 16.5, page 460
- Exercises 16.6, page 464
- Review Exercises for Chapter 16, page 466
- Exercises 17.1, page 474
- Exercises 17.2, page 479
- Exercises 17.3, page 484
- Exercises 17.4, page 488
- Exercises 17.5, page 491
- Exercises 17.6, page 495
- Review Exercises for Chapter 17, page 496
- Exercises 18.1, page 502
- Exercises 18.2, page 507
- Review Exercises for Chapter 18, page 510
- Exercises 19.1, page 517
- Exercises 19.2, page 521
- Exercises 19.3, page 525
- Exercises 19.4, page 530
- Review Exercises for Chapter 19, page 531
- Exercises 20.1, page 541
- Exercises 20.2, page 546
- Exercises 20.3, page 549
- Exercises 20.4, page 553
- Exercises 20.5, page 557
- Exercises 20.6, page 563
- Review Exercises for Chapter 20, page 565
- Exercises 21.1, page 572
- Exercises 21.2, page 577
- Exercises 21.3, page 582
- Exercises 21.4, page 586
- Exercises 21.5, page 592
- Exercises 21.6, page 597
- Exercises 21.7, page 601
- Exercises 21.8, page 604
- Exercises 21.9, page 608
- Exercises 21.10, page 611
- Exercises 21.11, page 615
- Review Exercises for Chapter 21, page 617
- Exercises 22.1, page 624
- Exercises 22.2, page 629
- Exercises 22.3, page 632
- Exercises 22.4, page 636
- Exercises 22.5, page 641
- Exercises 22.6, page 646
- Exercises 22.7, page 649
- Review Exercises for Chapter 22, page 651
- Solutions to Practice Test Problems
- INDEX OF APPLICATIONS
- Acoustics
- Aeronautics
- Architecture
- Astronomy
- Automotive Technology
- Biology and Medical Science
- Business and Finance
- Chemistry
- Civil Engineering
- Computer
- Construction
- Design
- Electricity and Electronics
- Energy Technology
- Environmental Science
- Fire Science
- Geodesy, Geology, Seismology
- Hydrodynamics and Hydrostatics
- Machine Technology
- Materials
- Measurement
- Meteorology
- Motion
- Navigation
- Nuclear and Atomic Physics
- Optics
- Petroleum
- Photography
- Physics
- Police Science
- Refrigeration and Air Conditioning
- Space Technology
- Statics
- Strength of Materials
- Surveying
- Thermal
- Thermodynamics
- Wastewater Technology
- Index
22 Introduction to Statistics
LEARNING OUTCOMES
After completion of this chapter, the student should be able to:
Use bar graphs and pie charts to display qualitative data
Summarize and display quantitative data using frequency distributions, histograms, stem-and-leaf plots, and time series plots
Calculate measures of central tendency (mean, median, and mode)
Calculate and interpret the standard deviation
Apply the empirical rule
Find relative frequencies involving normally distributed populations
Plot and interpret
x ¯ , R, and p control chartsFind the equation of the least squares regression line that best fits a given set of data
Use a calculator to determine a nonlinear regression model to fit a set of data
After the invention of the steam engine in the late 1700s by the Scottish engineer James Watt, the production of machine-made goods became widespread during the 1800s. However, it was not until the 1920s that much attention was paid to the quality control of the goods being produced. In 1924, Walter Shewhart of Bell Telephone Laboratories used a statistical chart for controlling product variables; in the 1940s, quality control was used in much of wartime production.
Quality control is one of the modern uses of statistics, the branch of mathematics in which data are collected, analyzed, and interpreted. Today it is nearly impossible to read a newspaper or watch television news without seeing some type of study, in areas such as medicine or politics, that involves statistics. Other fields in which statistical methods are used include biology, physics, psychology, sociology, economics, business, education, and electronics.
The first significant use of statistics was made in the 1660s by John Graunt and in the 1690s by Edmund Halley (Halley’s Comet), when each published some conclusions about the population in England based on mortality tables. There was little development of statistics until the 1800s, when statistical measures became more widely used. Examples are the scientist Francis Galton, who used statistics in the study of human heredity, and the nurse Florence Nightingale, who used statistical graphs to show that more soldiers died in the Crimean War (in the 1850s) from unsanitary conditions than from combat wounds.
This chapter is an introduction to some of the basic concepts and uses of statistics. We first consider certain basic statistical measures. Then a section is devoted to normal distributions, followed by a section on control charts that are used in statistical process control in industry. The final sections show how to start with a set of points on a graph and find an equation that best “fits” the data. This equation, which shows a basic relationship between the variables, can be useful in research.
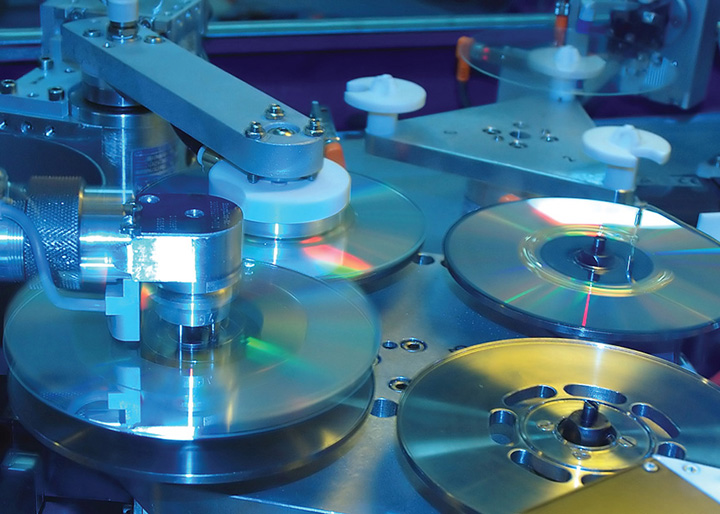
Statistical analysis is used extensively in business and industry. In Section 22.5, we show how a control chart can be used to monitor the defects on DVDs.
-
No Comment