
21.11 Curves in Polar Coordinates
Curve Sketched from Equations • Plotting Polar Coordinate Curves • Calculator Display of Polar Curves • Polar Curve Generated by Data
The basic method for finding a curve in polar coordinates is the same as in rectangular coordinates. We assume values of the independent variable—in this case, —and then find the corresponding values of the dependent variable r. These points are then plotted and joined, thereby forming the curve that represents the relation in polar coordinates.
Before using the basic method, it is useful to point out that certain basic curves can be sketched directly from the equation. This is done by noting the meaning of each of the polar coordinate variables, r and This is illustrated in the following example.
EXAMPLE 1 Curves sketched from equations
The graph of the polar equation is a circle of radius 3, with center at the pole. This can be seen to be the case, since for all possible values of It is not necessary to find specific points for this circle, which is shown in Fig. 21.112.
The graph of is a straight line through the pole. It represents all points for which for all possible values of r. This line is shown in Fig. 21.112.
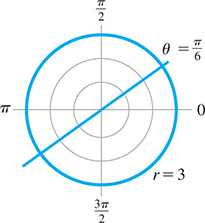
Fig. 21.112
EXAMPLE 2 Plotting a cardioid
Plot the graph of
First, for each of the chosen values of we calculate the value for r. Then, to plot these points we identify the ray that represents the value of and then place the point the proper number of units for the value of r out on that ray. We then connect the points as shown in Fig. 21.113.
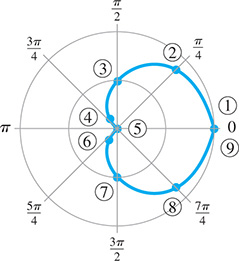
Fig. 21.113
0 |
|||||||||
| r | 2 | 1.7 | 1 | 0.3 | 0 | 0.3 | 1 | 1.7 | 2 |
| Point Number | 1 | 2 | 3 | 4 | 5 | 6 | 7 | 8 | 9 |
We now see that the points are repeating, and it is unnecessary to find additional points. This curve is called a cardioid.
EXAMPLE 3 Plotting a limaçon
Plot the graph of
Choosing values of and then finding the corresponding values of r, we find the following table of values.
0 |
|||||||||
| r | 1 | 1 | 2.4 | 3 | 2.4 | 1 | |||
| Point Number | 1 | 2 | 3 | 4 | 5 | 6 | 7 | 8 | 9 |
NOTE
[Particular care should be taken in plotting the points for which r is negative. We recall that when r is negative, the point is on the side opposite the pole from which it is positive.]
This curve is known as a limaçon and is shown in Fig. 21.114.
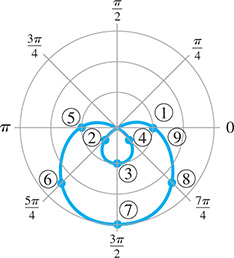
Fig. 21.114
EXAMPLE 4 Plotting a rose
Plot the graph of
In finding values of r, we must be careful first to multiply the values of by 2 before finding the cosine of the angle. Also, for this reason, we take values of as multiples of so as to get enough useful points. The table of values follows:
0 |
|||||||
| r | 2 | 1.7 | 1 | 0 |
| r | 0 | 1 | 1.7 | 2 |
For values of starting with the values of repeat. We have a four-leaf rose, as shown in Fig. 21.115.

Fig. 21.115
EXAMPLE 5 Plotting a lemniscate
Plot the graph of
Choosing the indicated values of we get the values of r as shown in the following table of values:
0 |
… |
||||||
| r | 0 | 0 |
There are no values of r corresponding to values of in the range since twice these angles are in the second and third quadrants and the cosine is negative for such angles. The value of cannot be negative. Also, the values of r repeat for The figure is called a lemniscate and is shown in Fig. 21.116.

Fig. 21.116
EXAMPLE 6 Calculator display of a polar curve
View the graph of on a calculator.
Using the mode feature, a polar curve is displayed using the polar graph option or the parametric graph option, depending on the calculator. (Review the manual for the calculator.) The graph displayed will be the same with either method.
With the polar graph option, the function is entered directly. The values for the viewing window are determined by settings for x, y and the angles that will be used. These values are set in a manner similar to those used for parametric equations. (See page 317 for an example of graphing parametric equations.)
With the parametric graph option, to graph we note that and This tells us that
Thus, for by using
the graph can be displayed, as shown in Fig. 21.117.

Fig. 21.117
Graphing calculator keystrokes: bit.ly/
EXAMPLE 7 Polar graph from data—cardioid microphone
A cardioid microphone, commonly used for vocals or speech, is designed to pick up sound in front of the microphone but reject sound coming from behind the microphone. It gets its name from the fact that its polar sensitivity pattern is heart-shaped as shown in Fig. 21.118. The polar graph shows how sensitive the microphone is in picking up sound coming from different angles. The maximum sensitivity is at , which is directly in front of the microphone. At other angles, the microphone is less sensitive, and therefore there is a decrease in decibels (dB). For example, at to either side, there is about a 1-dB drop, and at , the decrease is about 7 dB.
Polar patterns such as these are found by revolving a sound source in a circle around a microphone placed at the center and measuring the sound picked up by the microphone. Other types of microphones have circular or figure-eight shaped polar patterns.
Note that is located straight upward instead of toward the right as is usually done in mathematics. Also notice that the angles increase as you rotate clockwise instead of the usual counterclockwise.

Fig. 21.118
Exercises 21.11
In Exercises 1–4, make the given changes in the indicated examples of this section and then make the indicated graphs.
In Example 1(b), change to
In Example 3, change the before the to
In Example 4, change cos to sin.
In Example 7, what is the decibel loss when the sound approaches the microphone from the point directly in front of the microphone?
In Exercises 5–32, plot the curves of the given polar equations in polar coordinates.
(cardioid)
(cardioid)
(limaçon)
(limaçon)
(rose)
(rose)
(lemniscate)
(spiral)
(spiral)
(cissoid)
(ellipse)
(parabola)
(hyperbola)
(ellipse)
In Exercises 33–42, view the curves of the given polar equations on a calculator.
In Exercises 43–54, solve the given problems: sketch or display the indicated curves.
What is the graph of Verify by changing the equation to rectangular form.
Find the polar equation of the line through the polar points (1, 0) and
Using a calculator, show that the curves and intersect at right angles. Proper window settings are necessary.
Using a calculator, determine what type of graph is displayed by
Display the graph of on a calculator, using (a) the polar curve mode, and (b) the parametric curve mode. (See Example 6).
Display the graph of on a calculator, using (a) the polar curve mode, and (b) the parametric curve mode. (See Example 6).
An architect designs a patio shaped such that it can be described as the area within the polar curve where measurements are in meters. Sketch the curve that represents the perimeter of the patio.
The radiation pattern of a certain television transmitting antenna can be represented by where distances (in km) are measured from the antenna. Sketch the radiation pattern.
The joint between two links of a robot arm moves in an elliptical path (in cm), given by Sketch the path.
A missile is fired at an airplane and is always directed toward the airplane. The missile is traveling at twice the speed of the airplane. An equation that describes the distance r between the missile and the airplane is where is the angle between their directions at all times. See Fig. 21.119. This is a relative pursuit curve. Sketch the graph of this equation for
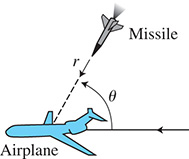
Fig. 21.119
In studying the photoelectric effect, an equation used for the rate R at which photoelectrons are ejected at various angles is Sketch the graph.
 Noting the graphs in Exercises 17, 18, 37, and 38, what conclusion do you draw about the value of n and the graph of or
Answers to Practice Exercises
Straight line
Circle