CHAPTER 22 REVIEW EXERCISES
CONCEPT CHECK EXERCISES
Determine each of the following as being either true or false. If it is false, explain why.
If the raw data includes 25 values, and a class includes 3 of these values, the relative frequency of this class is 12%.
The mean of the numbers 2, 3, 6, 4, 5 is 4.
The standard deviation of the numbers 2, 3, 6, 4, 5 is .
For a normal distribution for which and the z-scores for and are and
If the least-squares line for a set of data is the deviation of the data point (2, 6) is 4.
In linear regression, a value of r close to 0 indicates a good fit.
PRACTICE AND APPLICATIONS
In Exercises 7–14, use the following data. An airline’s records showed that the percent of on-time flights each day for a 20-day period was as follows:
72, 75, 76, 70, 77, 73, 80, 75, 82, 85,
77, 78, 74, 86, 72, 77, 67, 78, 69, 80
Determine the median.
Determine the mode.
Determine the mean.
Determine the standard deviation.
Construct a frequency distribution table with class limits of 67, 71, 75, 79, 83, and 87.
Make a stem-and-leaf plot of these data using split stems.
Draw a histogram for the data using the table from Exercise 11.
Construct a relative frequency table for the data using the class limits given in Exercise 11.
In Exercises 15 and 16, use the following information. For the employees of a certain business, the highest education level is summarized below:
| Education | Frequency |
|---|---|
| No high school diploma | 4 |
| High school diploma | 8 |
| 2-year college degree | 18 |
| 4-year college degree or higher | 10 |
Use the frequencies to make a bar graph of these data.
Using relative frequencies, make a pie chart of these data.
In Exercises 17–20, use the following data. In testing the water supply of a town, the volume V (in mL/L) of settleable solids over a 12-day period were as follows (readings of are considered acceptable): 0.11, 0.15, 0.16, 0.13, 0.14, 0.13, 0.12, 0.14, 0.15, 0.13, 0.13, 0.12.
Find the mean.
Find the median.
Find the standard deviation.
Draw a histogram.
In Exercises 21–24, use the following data. A sample of wind generators was tested for power output when the wind speed was 30 km/h. The following table gives the powers produced (to the nearest 10 W) and the number of generators for each power value.
| Power (W) | 650 | 660 | 670 | 680 | 690 |
| No. Generators | 3 | 2 | 7 | 12 | 27 |
| Power (W) | 700 | 710 | 720 | 730 |
| No. Generators | 34 | 15 | 16 | 5 |
Find the median.
Find the mean.
Find the standard deviation.
Find the mode.
In Exercises 25–28, use the following data. In an experiment to measure cosmic radiation, the number of cosmic rays was recorded for 200 different 5-s intervals. The grouped data are shown below:
| No. of Cosmic Rays | 0 | 1 | 2 | 3 | 4 | 5 | 6 | 7 | 8 | 9 | 10 |
| Frequency | 3 | 10 | 25 | 45 | 29 | 39 | 26 | 11 | 7 | 2 | 3 |
Find the mean.
Find the median.
Find the standard deviation.
Make a relative frequency table.
In Exercises 29–32, use the following information. IQ scores are normally distributed with a mean and a standard deviation
According to the empirical rule, approximately what percentage of IQ scores are between 70 and 130?
According to the empirical rule, approximately what percentage of IQ scores are between 55 and 145?
Find and interpret the z-score of an IQ of 127.
Find the IQ score that has a z-score of
In Exercises 33 and 34, use the following information. A company that makes electric light bulbs tests 500 bulbs each day for defects. The number of defective bulbs, along with the proportion of defective bulbs for 20 days, is shown in the following table.
| Day | Number Defective | Proportion Defective |
|---|---|---|
| 1 | 23 | 0.046 |
| 2 | 31 | 0.062 |
| 3 | 19 | 0.038 |
| 4 | 27 | 0.054 |
| 5 | 29 | 0.058 |
| 6 | 39 | 0.078 |
| 7 | 26 | 0.052 |
| 8 | 17 | 0.034 |
| 9 | 28 | 0.056 |
| 10 | 33 | 0.066 |
| 11 | 22 | 0.044 |
| 12 | 29 | 0.058 |
| 13 | 20 | 0.040 |
| 14 | 35 | 0.070 |
| 15 | 21 | 0.042 |
| 16 | 32 | 0.064 |
| 17 | 25 | 0.050 |
| 18 | 23 | 0.046 |
| 19 | 29 | 0.058 |
| 20 | 32 | 0.064 |
| Total | 540 |
For a p chart, find the values of the central line, UCL, and LCL.
Plot a p chart.
In Exercises 35 and 36, use the following information. Five ball bearings are taken from the production line every 15 min and their diameters are measured. The diameters of the sample ball bearings for 16 successive subgroups are given in the following table.
| Subgroup | Diameters (mm) of Five Ball Bearings | ||||
|---|---|---|---|---|---|
| 1 | 4.98 | 4.92 | 5.02 | 4.91 | 4.93 |
| 2 | 5.03 | 5.01 | 4.94 | 5.06 | 5.07 |
| 3 | 5.05 | 5.03 | 5.00 | 5.02 | 4.96 |
| 4 | 5.01 | 4.92 | 4.91 | 4.99 | 5.03 |
| 5 | 4.92 | 4.97 | 5.02 | 4.95 | 4.94 |
| 6 | 5.02 | 4.95 | 5.01 | 5.07 | 5.15 |
| 7 | 4.93 | 5.03 | 5.02 | 4.96 | 4.99 |
| 8 | 4.85 | 4.91 | 4.88 | 4.92 | 4.90 |
| 9 | 5.02 | 4.95 | 5.06 | 5.04 | 5.06 |
| 10 | 4.98 | 4.98 | 4.93 | 5.01 | 5.00 |
| 11 | 4.90 | 4.97 | 4.93 | 5.05 | 5.02 |
| 12 | 5.03 | 5.05 | 4.92 | 5.03 | 4.98 |
| 13 | 4.90 | 4.96 | 5.00 | 5.02 | 4.97 |
| 14 | 5.09 | 5.04 | 5.05 | 5.02 | 4.97 |
| 15 | 4.88 | 5.00 | 5.02 | 4.97 | 4.94 |
| 16 | 5.02 | 5.09 | 5.03 | 4.99 | 5.03 |
Plot an chart.
Plot an R chart.
In Exercises 37–40, solve the given problems.
Find the area under the standard normal curve between and
Find the area under the standard normal curve to the right of
Find the two z-scores that bound the middle 83.84% of the area under the standard normal curve.
Find the z-score that has an area to the right of 0.0287 under the standard normal curve.
In Exercises 41–44, use the following data. After analyzing data for a long period of time, it was determined that the readings of an organic pollutant for an area are distributed normally with and .
What percentage of the readings are between and
What percentage of the readings are between and
What percentage of the readings are above
What percentage of the readings are below
In Exercises 45–54, find the indicated regression models. Sketch the curve and data points on the same graph.
In a certain experiment, the resistance R of a certain resistor was measured as a function of the temperature T. The data found are shown in the following table. Find the regression line that expresses R as a function of T.
T () 0.0 20.0 40.0 60.0 80.0 100 25.0 26.8 28.9 31.2 32.8 34.7 An air-pollution monitoring station took samples of air each hour during the later morning hours and tested each sample for the number n of parts per million (ppm) of carbon monoxide. The results are shown in the table, where t is the number of hours after 6 a.m. Find the regression line that expresses n as a function of t.
t (h) 0.0 1.0 2.0 3.0 4.0 5.0 6.0 n (ppm) 8.0 8.2 8.8 9.5 9.7 10.0 10.7 The Mach number of a moving object is the ratio of its speed to the speed of sound (740 mi/h). The following table shows the speed s of a jet aircraft, in terms of Mach numbers, and the time t after it starts to accelerate. Find the regression line that expresses s as a function of t.
t (min) 0.00 0.60 1.20 1.80 2.40 3.00 s (Mach number) 0.88 0.97 1.03 1.11 1.19 1.25 The distance s of a missile above the ground at time t after being released from a plane is given by the following table (see Fig. 22.33). Find the equation of the quadratic regression model for these data.

Fig. 22.33
t (s) 0.0 3.0 6.0 9.0 12.0 15.0 18.0 s (m) 3000 2960 2820 2600 2290 1900 1410 In an experiment to determine the relation between the load x on a spring and the length y of the spring, the following data were found. Find the regression line that expresses y as a function of x.
Load (lb) 0.0 1.0 2.0 3.0 4.0 5.0 Length (in.) 10.0 11.2 12.3 13.4 14.6 15.9 In an elementary experiment that measured the wavelength L of sound as a function of the frequency f, the following results were obtained.
f (Hz) 240 320 400 480 560 L (cm) 140 107 81.0 70.0 60.0 Find the equation of the exponential regression model for these data that expresses L as a function of f.
For the data in Exercise 50, find equations for the quadratic, logarithmic, and power regression models. Which of these three models fits the data the least well?
The power P (in W) generated by a wind turbine was measured for various wind velocities v (in mi/h), as shown in the following table.
v (mi/h) 10 15 20 25 30 40 P (W) 75 250 600 1200 2100 4800 Find the equation of the cubic regression model for these data.
The vertical distance y of the cable of a suspension bridge above the surface of the bridge is measured at a horizontal distance x along the bridge from its center. See Fig. 22.34. The results are as follows:
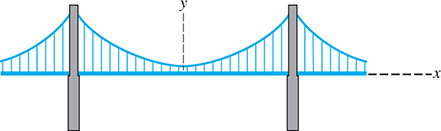
Fig. 22.34
x (m) 0 100 200 300 400 500 y (m) 15 17 23 33 47 65 Find the equation of the quadratic regression model for these data.
The chlorine residual r (in ppm—parts per million) was measured in a swimming pool every 12 h after chemical treatment, with the following results:
t (in h) 0 12 24 36 48 60 72 r (ppm) 2.05 1.71 1.42 1.19 0.99 0.83 0.71 Find the equation of the exponential regression model for these data that expresses r as a function of t.
In Exercises 55–58, find the indicated regression model for the following data. Using aerial photography, the area A (in ) of an oil spill as a function of the time t (in h) after the spill was found to be as follows:
| t (h) | 1.0 | 2.0 | 4.0 | 6.0 | 8.0 | 10.0 |
| 1.4 | 2.5 | 4.7 | 6.8 | 8.8 | 10.2 |
Find the linear equation to fit these data.
Find the quadratic equation to fit these data.
Find the power equation to fit these data.
Compare the values of the coefficient of correlation r, to determine whether the linear equation or power equation seems to fit the data better.
In Exercises 59 and 60, solve the given problems.
Show that Eq. (22.8) and (22.9) satisfy the equation .
The sales (in millions of dollars) for a company is shown below. Make a time series plot of the data.
Year 2012 2013 2014 2015 2016 Sales 1.2 1.4 1.6 1.5 1.8  A research institute is planning a study of the effect of education on the income of workers. Explain what data should be collected and which of the measures discussed in this chapter would be useful in analyzing the data.