3.3 Rectangular Coordinates
Rectangular Coordinate System
One of the most valuable ways of representing a function is by graphical representation. By using graphs, we can obtain a “picture” of the function; by using this picture, we can learn a great deal about the function.
To make a graphical representation of a function, recall from Chapter 1 that numbers can be represented by points on a line. For a function, we have values of the independent variable as well as the corresponding values of the dependent variable. Therefore, it is necessary to use two different lines to represent the values from each of these sets of numbers. We do this by placing the lines perpendicular to each other.
Place one line horizontally and label it the x-axis. The values of the independent variable are normally placed on this axis. The other line is placed vertically and labeled the y-axis. Normally, the y-axis is used for values of the dependent variable. The point of intersection is called the origin. This is the rectangular coordinate system.
On the x-axis, positive values are to the right of the origin, and negative values are to the left of the origin. On the y-axis, positive values are above the origin, and negative values are below it. The four parts into which the plane is divided are called quadrants, which are numbered as in Fig. 3.8.

Fig. 3.8
A point P in the plane is designated by the pair of numbers (x, y), where x is the value of the independent variable and y is the value of the dependent variable. The x-value is the perpendicular distance of P from the y-axis, and the y-value is the perpendicular distance of P from the x-axis. The values of x and y, written as (x, y), are the coordinates of the point P.
EXAMPLE 1 Locating points
Locate the points A(2, 1) and on the rectangular coordinate system.
The coordinates (2, 1) for A mean that the point is 2 units to the right of the y-axis and 1 unit above the x-axis, as shown in Fig. 3.9. The coordinates for B mean that the point is 4 units to the left of the y-axis and 3 units below the x-axis, as shown. The x-coordinate of A is 2, and the y-coordinate of A is 1. For point B, the x-coordinate is and the y-coordinate is
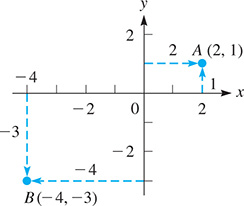
Fig. 3.9
The positions of points P(4, 5), and T(0, 3) are shown in Fig. 3.8. We see that this representation allows for one point for any pair of values (x, y). Also note that the point T(0, 3) is on the y-axis. Any such point that is on either axis is not in any of the four quadrants.
NOTE
[Note very carefully that the x-coordinate is always written first, and the y-coordinate is always written second. For this reason, (x, y) is called an ordered pair.]
It is very important to keep the proper order when writing the coordinates of a point. (The x-coordinate is also known as the abscissa, and the y-coordinate is also known as the ordinate.)
EXAMPLE 2 Coordinates of vertices of rectangle
Three vertices of the rectangle in Fig. 3.10 are and C(4, 1). What is the fourth vertex?

Fig. 3.10
We use the fact that opposite sides of a rectangle are equal and parallel to find the solution. Because both vertices of the base AB of the rectangle have a y-coordinate of the base is parallel to the x-axis. Therefore, the top of the rectangle must also be parallel to the x-axis. Thus, the vertices of the top must both have a y-coordinate of 1, because one of them has a y-coordinate of 1. In the same way, the x-coordinates of the left side must both be Therefore, the fourth vertex is
EXAMPLE 3 Locating sets of points
Where are all the points whose y-coordinates are 2?
We can see that the question could be stated as: “Where are all the points for which ” Because all such points are two units above the x-axis, the answer could be stated as “on a horizontal line 2 units above the x-axis.” See Fig. 3.11.
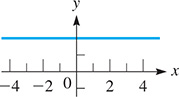
Fig. 3.11
Where are all points (x, y) for which and
Noting that means “x is less than zero,” or “x is negative,” and that means the same for y, we want to determine where both x and y are negative. Our answer is “in the third quadrant,” because both coordinates are negative for all points in the third quadrant, and this is the only quadrant for which this is true. See Fig. 3.12.

Fig. 3.12
EXERCISES 3.3
In Exercises 1 and 2, make the given changes in the indicated examples of this section, and then solve the resulting problems.
In Example 2, change to and then find the fourth vertex.
In Example 3(b), change to and then find the location of the points (x, y).
In Exercises 3 and 4, determine (at least approximately) the coordinates of the points shown in Fig. 3.13.
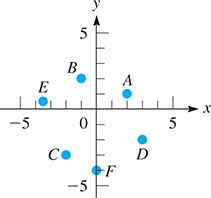
Fig. 3.13
A, B, C
D, E, F
In Exercises 5 and 6, plot the given points.
In Exercises 7–10, plot the given points and then join these points, in the order given, by straight-line segments. Name the geometric figure formed.
In Exercises 11–14, find the indicated coordinates.
Three vertices of a rectangle are and What are the coordinates of the fourth vertex?
Two vertices of an equilateral triangle are (7, 1) and (2, 1). What is the x-coordinate of the third vertex?
P is the point (3, 6). Locate point Q such that the x-axis is the perpendicular bisector of the line segment joining P and Q.
P is the point Locate point Q such that the line segment joining P and Q is bisected by the origin.
In Exercises 15–18, determine the quadrant in which the point (x, y) lies.
and
and
and
and
In Exercises 19–38, answer the given questions.
Where are all points whose x-coordinates are 1?
Where are all points whose y-coordinates are
Where are all points such that
Where are all points such that
Where are all points whose x-coordinates equal their y-coordinates?
Where are all points whose x-coordinates equal the negative of their y-coordinates?
What is the x-coordinate of all points on the y-axis?
What is the y-coordinate of all points on the x-axis?
Where are all points for which
Where are all points for which
Where are all points for which
Where are all points for which
Where are all points for which
Where are all points for which
Where are all points for which
Where are all points for which
If the point (a, b) is in the second quadrant, in which quadrant is
 The points and (x, y) are on the same straight line. Describe this line.
On a circular machine part, holes are to be drilled at the points and where (0, 0) represents the center. Plot these points and find the distance between the points in quadrants I and III.
Join the points and in order with straight-line segments. Find the distances between successive points and then identify the geometric figure formed.
Answer to Practice Exercise
On the positive y-axis