7.4 The Graph of the Quadratic Function
The Parabola • Vertex and y-intercept • Solving Quadratic Equations Graphically
In this section, we discuss the graph of the quadratic function and show the graphical solution of a quadratic equation. By letting we can graph this function, as in Chapter 3.
EXAMPLE 1 Graphing a quadratic function
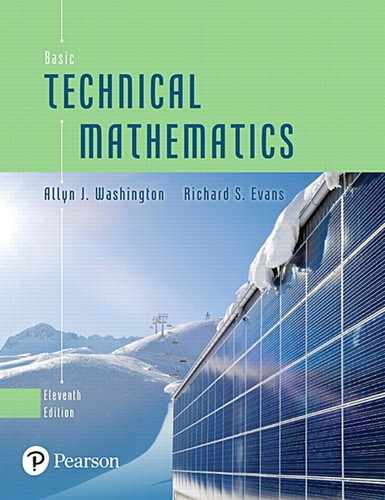
Graph the function
First, let Then set up a table of values and graph the function as shown in Fig. 7.11. We can also display it on a calculator as shown in Fig. 7.12.
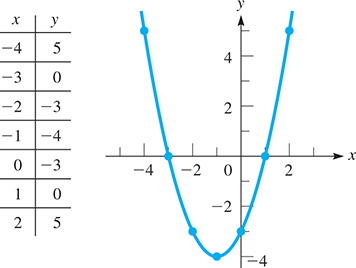
Fig. 7.11
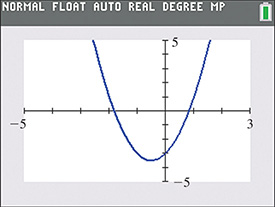
Fig. 7.12
The shape of the graph in Figs. 7.11 and 7.12 is called a parabola, and the graph of any quadratic function will have the same basic shape. A parabola can open upward (as in Example 1) or downward. The location of the parabola and how it opens depends on the values of a, b, and c.
In Example 1, the parabola has a minimum point at and the curve opens upward. All parabolas have an extreme point of this type.
NOTE
[For if the parabola has a minimum point and opens upward. If the parabola has a maximum point and opens downward.]
The extreme point of the parabola is known as its vertex.
EXAMPLE 2 Parabola—extreme points
The graph of is shown in Fig. 7.13(a). For this parabola, and it opens upward. The vertex (a minimum point) is
Fig. 7.13
The graph of is shown in Fig. 7.13(b). For this parabola, and it opens downward. The vertex (a maximum point) is (2, 2).
We can sketch the graphs of a parabola by using its basic shape and knowing two or three points, including the vertex. Even when using a graphing calculator, we can get a check on the graph by knowing the vertex and how the parabola opens.
In order to find the coordinates of the extreme point, start with the quadratic function
Then factor a from the two terms containing x, obtaining
Now, completing the square of the terms within parentheses, we have
NOTE
[This form of the function shows a horizontal shift of which means the vertex is at .]
The y-coordinate of the vertex can be found by substituting this x-value into the original function.
Another easily found point is the y-intercept. By substituting into we get This means that the point (0, c) is the y-intercept. This information is summarized below.
EXAMPLE 3 Graphing a parabola—vertex—y-intercept
For the graph of the function find the vertex and y-intercept and sketch the graph. (This function was also used in Example 2.)
First, and This means that the x-coordinate of the vertex is
and the y-coordinate is
Thus, the vertex is Because it is a minimum point.
Because the y-intercept is (0,6).
We can use the minimum point and the y-intercept (0, 6), along with the fact that the graph is a parabola, to get an approximate sketch of the graph. Noting that a parabola increases (or decreases) away from the vertex in the same way on each side of it (it is symmetric with respect to a vertical line through the vertex), we sketch the graph in Fig. 7.14. It is the same graph as that shown in Fig. 7.13(a).
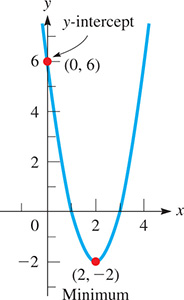
Fig. 7.14
If we are not using a graphing calculator, we may need one or two additional points to get a good sketch of a parabola. This would be especially true if the y-intercept is close to the vertex. Two points we can find are the x-intercepts, if the parabola crosses the x-axis (one point if the vertex is on the x-axis). They are found by setting and solving the quadratic equation Also, we may simply find one or two points other than the vertex and the y-intercept. Sketching a parabola in this way is shown in the following two examples.
EXAMPLE 4 Graphing a parabola using the vertex and intercepts
Sketch the graph of
We first note that and Therefore, the x-coordinate of the maximum point is The y-coordinate is This means that the maximum point is
The y-intercept is (0,6).
We can see from Fig. 7.15 that the vertex and y-intercept are too close together for us to get a good idea of the shape of the parabola, so additional points are needed. We will find the x-intercepts.
This means that the x-intercepts are (3, 0) and as shown in Fig. 7.15.
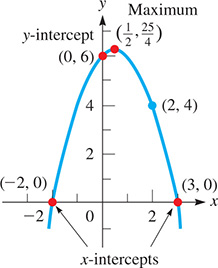
Fig. 7.15
Also, rather than finding the x-intercepts, we can let (or some value to the right of the vertex) and then use the point (2, 4).
Note that the y-coordinate of the vertex can be used to find the range of a quadratic function. In this case, the range is all values The domain is all real numbers.
EXAMPLE 5 Graphing a parabola—no x-term
Sketch the graph of
Because there is no x-term, This means that the x-coordinate of the minimum point is 0 and that the minimum point and the y-intercept are both (0, 1). We know that the graph opens upward, because which in turn means that it does not cross the x-axis. Now, letting and find the points (2, 5) and on the graph, which is shown in Fig. 7.16.
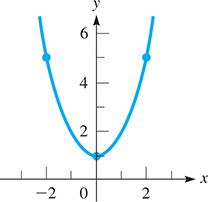
Fig. 7.16
EXAMPLE 6 Finding a quadratic function—Golden Gate Bridge
The Golden Gate Bridge in San Francisco is a suspension bridge, and its supporting cables are parabolic. With the origin at the low point of the cable, find the equation that represents the height of the parabolic cables if the towers are 4200 ft apart and the maximum sag is 300 ft? See Fig. 7.17.

Fig. 7.17
Since both the y-intercept and vertex are at the origin, the desired equation must be of the form We also know that the point (2100, 300) is on the parabola. By substituting these values into the equation, we can solve for a:
Thus, the equation for the cable is This can be used to find the height of the vertical supports at any desired location.
SOLVING QUADRATIC EQUATIONS GRAPHICALLY
In Section 3.5, we showed that to solve an equation graphically, we (1) collect all terms on the left side of the equation, with zero on the right side, (2) graph the function on the left side, and (3) use the zero feature to find the x-coordinate(s) of the x-intercepts. This procedure works for all equations, including quadratic equations. We used this to check the solutions obtained in Example 3 of Section 7.2. Another method for solving an equation graphically is to use the intersect feature to find the point(s) of intersection between the left and right sides of the equation. This method does not require having a zero on the right side. The following example illustrates these methods.
EXAMPLE 7 Solving equation graphically—height of a projectile
A projectile is fired vertically upward from the ground with a velocity of 38 m/s. Its distance above the ground is given by where s is the distance (in m) and t is the time (in s). Graph the function, and from the graph determine (1) when the projectile will hit the ground, (2) how long it takes to reach 45 m above the ground, and (3) the maximum height of the projectile.
To find when the projectile hits the ground, we set the height and then solve for t. This results in the equation Graphically, this is the x-intercept of the function which can be found using the zero feature on a calculator. The solution is as shown in Fig. 7.18(a).
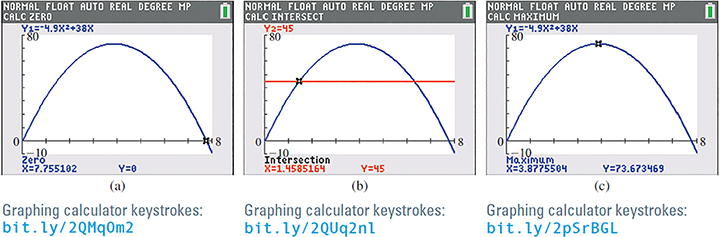
Fig. 7.18
To find when the projectile is 45 m above the ground, we can use the intersect feature to find the points of intersection between the given function and the horizontal line There are two solutions: and The first of these solutions is shown in Fig. 7.18(b).
The maximum height occurs at the vertex, which can be found using the maximum feature on a calculator. From Fig. 7.18(c), we see that the maximum height is 73.7 m, which occurs after 3.88 s.
EXERCISES 7.4
In Exercises 1 and 2, make the given changes in the indicated examples of this section and then solve the resulting problems.
In Example 3, change the sign before 8x to and then sketch the graph.
In Example 7, change 38 to 42 and then answer the questions.
In Exercises 3–8, sketch the graph of each parabola by using only the vertex and the y-intercept. Check the graph using a calculator.
In Exercises 9–12, sketch the graph of each parabola by using the vertex, the y-intercept, and the x-intercepts. Check the graph using a calculator.
In Exercises 13–16, sketch the graph of each parabola by using the vertex, the y-intercept, and two other points, not including the x-intercepts. Check the graph using a calculator.
In Exercises 17–24, use a calculator to solve the given equations. Round solutions to the nearest hundredth. If there are no real roots, state this.
![]() In Exercises 25–30, use a calculator to graph all three parabolas on the same coordinate system. In Exercises 25–28, describe (a) the shifts (see page 105) of that occur and (b) how each parabola opens. In Exercises 29 and 30, describe (a) the shifts and (b) the stretching and shrinking.
In Exercises 25–30, use a calculator to graph all three parabolas on the same coordinate system. In Exercises 25–28, describe (a) the shifts (see page 105) of that occur and (b) how each parabola opens. In Exercises 29 and 30, describe (a) the shifts and (b) the stretching and shrinking.
In Exercises 31–50, solve the given applied problem.
Use a calculator to find the vertex of Round the coordinates to the nearest hundredth.
Find the range of the function
Find the equation of the quadratic function that has vertex (0, 0) and passes through the point (25, 125).
A parabolic satellite dish is 8.40 in. deep and 36.0 in. across its opening. If the dish is positioned so it opens directly upward with its vertex at the origin, find the equation of its parabolic cross section.
Find the smallest integer value of c such that has at least one real root.
Find the smallest integer value of c such that has no real roots.
Find the equation of the parabola that contains the points and (2, 5).
Find the equation of the parabola that contains the points and (2, 8).
The vertical distance d (in cm) of the end of a robot arm above a conveyor belt in its 8-s cycle is given by Sketch the graph of
When mineral deposits form a uniform coating 1 mm thick on the inside of a pipe of radius r (in mm), the cross-sectional area A through which water can flow is Sketch
The shape of the Gateway Arch in St. Louis can be approximated by the parabola (in meters) if the origin is at ground level, under the center of the Arch. Display the equation representing the Arch on a calculator. How high and wide is the Arch?
Under specified conditions, the pressure loss L (in per 100 ft), in the flow of water through a fire hose in which the flow is q gal/min, is given by Sketch the graph of L as a function of q, for
A computer analysis of the power P (in W) used by a pressing machine shows that where i is the current (in A). Sketch the graph of
Tests show that the power P (in hp) of an automobile engine as a function of r (in r/min) is given by Sketch the graph of P vs. r and find the maximum power that is produced.
The height h (in m) of a fireworks shell shot vertically upward as a function of time t (in s) is How long should the fuse last so that the shell explodes at the top of its trajectory?
In a certain electric circuit, the resistance R (in ) that gives resonance is found by solving the equation Solve this equation graphically (to ).
If the radius of a circular solar cell is increased by 1.00 cm, its area is What was the original radius?
The diagonal of a rectangular floor is 3.00 ft less than twice the length of one of the sides. If the other side is 15.0 ft long, what is the area of the floor?
A security fence is to be built around a rectangular parking area of If the front side of the fence costs $20/ft and the other three sides cost $10/ft, solve graphically for the dimensions (to 1 ft) of the parking area if the fence is to cost $7500. See Fig. 7.19.
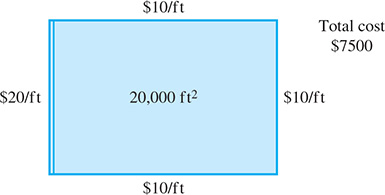
Fig. 7.19
An airplane pilot could decrease the time t (in h) needed to travel the 630 mi from Ottawa to Milwaukee by 20 min if the plane’s speed v is increased by 40 mi/h. Set up the appropriate equation and solve graphically for v (to two significant digits).
Answers to Practice Exercise
minimum