21.2 The Straight Line
Point-slope Form of Equation • Vertical Line • Horizontal Line • Slope-intercept Form of Equation • General Form of Equation
In Chapter 5, we derived the slope-intercept form of the equation of the straight line. Here, we extend the development to include other forms of the equation of a straight line. Also, other methods of finding and applying these equations are shown. For completeness, we review some of the material in Chapter 5.
Using the definition of slope, we can derive the general type of equation that represents a straight line. This is another basic method of analytic geometry. That is, equations of a particular form can be shown to represent a particular type of curve. When we recognize the form of the equation, we know the kind of curve it represents. As we have seen, this is of great assistance in sketching the graph.
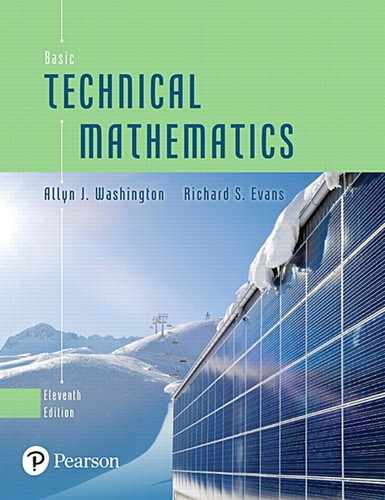
A straight line can be defined as a curve with a constant slope. This means that the value for the slope is the same for any two different points on the line that might be chosen. Thus, considering point on a line to be fixed (Fig. 21.15) and another point P(x, y) that represents any other point on the line, we have
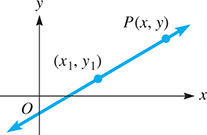
Fig. 21.15
which can be written as
Equation (21.6) is the point-slope form of the equation of a straight line. It is useful when we know the slope of a line and some point through which the line passes.
EXAMPLE 1 Point-slope form
Find the equation of the line that passes through with a slope of See Fig. 21.16.

Fig. 21.16
Substituting in Eq. (21.6), we find that
Simplifying, we have
EXAMPLE 2 Equation of a line through two points
Find the equation of the line through and (6, 2).
We first find the slope of the line through these points:
Then by using either of the two known points and Eq. (21.6), we can find the equation of the line (see Fig. 21.17):

Fig. 21.17
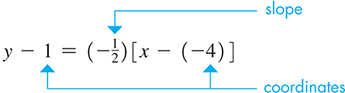
Equation (21.6) can be used for any line except for one parallel to the y-axis. Such a line has an undefined slope. However, it does have the property that all points on it have the same x-coordinate, regardless of the y-coordinate. We represent a line parallel to the y-axis as
Fig. 21.18
A line parallel to the x-axis has a slope of zero. From Eq. (21.6), we find its equation is To keep the same form as Eq. (21.7), we write this as
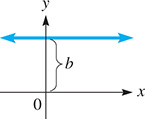
Fig. 21.19
EXAMPLE 3 Vertical line—horizontal line
The line is a line parallel to the y-axis and 2 units to the right of it. This line is shown in Fig. 21.20.
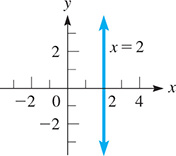
Fig. 21.20
The line is a line parallel to the x-axis and 4 units below it. This line is shown in Fig. 21.21.

Fig. 21.21
If we choose the special point (0, b), which is the y-intercept of the line, as the point to use in Eq. (21.6), we have or
Equation (21.9) is the slope-intercept form of the equation of a straight line, and we first derived it in Chapter 5. Its primary usefulness lies in the fact that once we find the equation of a line and then write it in slope-intercept form, we know that the slope of the line is the coefficient of the x-term and that it crosses the y-axis at the coordinate indicated by the constant term. See Fig. 21.22.
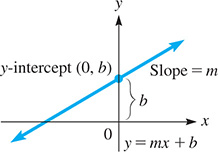
Fig. 21.22
EXAMPLE 4 Slope-intercept form
Find the slope and the y-intercept of the straight line for which the equation is
We write this equation in slope-intercept form:
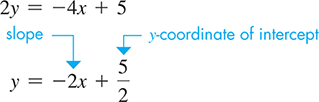
Because the coefficient of x in this form is the slope is The constant on the right is 5/2, which means that the y-intercept is (0, 5/2). See Fig. 21.23.
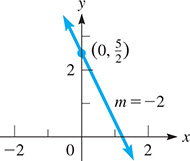
Fig. 21.23
An equation of a line can also be written in the form
which is known as the general form of the equation of the straight line.
EXAMPLE 5 General form
Find the general form of the equation of the line parallel to the line and that passes through the point
Because the line whose equation we want is parallel to the line it has the same slope. Thus, writing in slope-intercept form,
Because the slope of is the slope of the required line is also Using the point and the point-slope form, we have
This is the general form of the equation. Both lines are shown in Fig. 21.24.
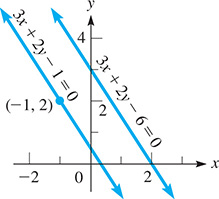
Fig. 21.24
In many physical situations, a linear relationship exists between variables as shown in the following two examples.
EXAMPLE 6 Straight line—slope as acceleration
For a period of 6.0 s, the velocity v of a car varies linearly with the elapsed time t. If when and when find the equation relating v and t and graph the function. From the graph, find the initial velocity and the velocity after 6.0 s. What is the meaning of the slope of the line?
With v as the dependent variable and t as the independent variable, the slope is
Using the information given in the statement of the problem, we have
Then using the point-slope form of the equation of a straight line, we have
The given values are sufficient to graph the line in Fig. 21.25. There is no need to include negative values of t, since they have no physical meaning. We see that the line crosses the v-axis at 35. This means that the initial velocity (for ) is 35 ft/s. Also, when we see that
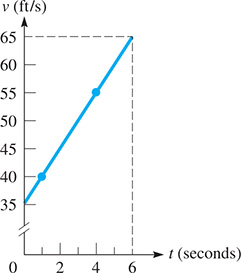
Fig. 21.25
The slope is the ratio of the change in velocity to the change in time. This is the car’s acceleration. Here, the speed of the car increases 5.0 ft/s each second. We can express this acceleration as
In Chapter 5, we showed how a calculator can be used to find a linear regression line to fit a set of data points that are approximately linear (see Example 11 of Section 5.1). The following example illustrates this process once again. The mathematics behind linear regression will be further developed in Chapter 22.
EXAMPLE 7 Linear regression—weight of a bear
The following table shows the chest girth (the distance around the chest) g (in inches) and the weight w (in lb) for a group of wild bears. Find the linear regression line for this data and use it to estimate the weight of a bear that has a chest girth of (a) 45.0 in. and (b) 60.0 in.
| Chest girth, g (in.) | 23.0 | 28.5 | 34.5 | 36.0 | 41.0 | 49.0 | 54.5 |
| Weight, w (lb) | 40.0 | 128 | 148 | 190 | 220 | 398 | 476 |
We first enter the chest girth and weight values into the calculator lists and , respectively, and make a scatterplot of the data. We then use the feature to get the equation of the regression line [see Fig. 21.26(a)]. Thus, the regression line is given by

Fig. 21.26
Graphing calculator keystrokes: bit.ly/
The slope is 13.716 and the w-intercept is Figure 21.26(b) shows the regression line plotted through the scatterplot.
To estimate the weight of a bear with chest girth 45.0 in., we evaluate This is called interpolation because the chest girth of 45.0 in. is inside the range of the given data. To estimate the weight of a bear with a chest girth of 60.0 in., we get This is called extrapolation because the chest girth 60.0 in. is outside the range of the given data.
EXERCISES 21.2
In Exercises 1–4, make the given changes in the indicated examples of this section and then solve the resulting problems.
In Example 1, change to
In Example 2, change to
In Example 4, change the before 4x to
In Example 5, change the before 2y to
In Exercises 5–20, find the equation of each of the lines with the given properties. Sketch the graph of each line.
Passes through with a slope of 4.
Passes through with a slope of
Passes through and (4, 2).
Has an x-intercept (4, 0) and a y-intercept of
Passes through with an inclination of .
Has a y-intercept and an inclination of .
Passes through and is parallel to the x-axis.
Passes through and is perpendicular to the x-axis.
Is parallel to the y-axis and is 3 units to the left of it.
Is parallel to the x-axis and is 4.1 units below it.
Perpendicular to line with slope of passes through
Parallel to line through and (3, 1); passes through
Has equal intercepts and passes through (5, 2).
Is perpendicular to the line and passes through
Has a slope of and passes through the intersection of the lines and
Passes through the point of intersection of and and through the point
In Exercises 21–28, reduce the equations to slope-intercept form and find the slope and the y-intercept. Sketch each line.
In Exercises 29–36, determine whether the given lines are parallel, perpendicular, or neither.
and
and
and
and
and
and
and
and
In Exercises 37–62, solve the given problems.
Find k if the lines and are parallel.
Find k if the lines given in Exercise 37 are perpendicular.
 Find k if the lines and are perpendicular. Explain how this value is found.
- Find k such that the line through (k, 2) and is perpendicular to the line Explain your method.
Find the shortest distance from (4, 1) to the line
Find the acute angle between the lines and
Show that the following lines intersect to form a parallelogram.
For nonzero values of a, b, and c, find the intercepts of the line
For nonzero values of a, b, c, and d, show that (a) lines and are parallel, and (b) lines and are perpendicular.
Find the equation of the line with positive intercepts that passes through (3, 2) and forms with the axes a triangle of area 12.
- The equation defines a family of lines, one for each value of k. On a calculator display the lines for and What conclusion do you draw about this family of lines?
- The equation defines a family of lines, one for each value of k. On a calculator display the lines for and What conclusion do you draw about this family of lines?
Show that the determinant equation at the right defines a straight line.
Find the equation of the line that has one negative intercept, passes through (3, 2), and forms with an axis and the line a triangle with an area of 12.
In the 1700s, the French physicist Reaumur established a temperature scale on which the freezing point of water was and the boiling point was . Set up an equation for the Fahrenheit temperature F (freezing point , boiling point ) as a function of the Reaumur temperature R.
The voltage V across part of an electric circuit is given by where E is a battery voltage, i is the current, and R is the resistance. If and for find V as a function of i. Sketch the graph (i and V may be negative).
The velocity of sound v increases 0.607 m/s for each increase in temperature T of . If for express v as a function of T.
An acid solution is made from x liters of a 20% solution and y liters of a 30% solution. If the final solution contains 20 L of acid, find the equation relating x and y.
- A wall is 15 cm thick. At the outside, the temperature is , and at the inside, it is . If the temperature changes at a constant rate through the wall, write an equation of the temperature T in the wall as a function of the distance x from the outside to a point inside the wall. What is the meaning of the slope of the line?
An oil-storage tank is emptied at a constant rate. At 10 a.m., 1800 barrels remain, and at 2 p.m., 600 barrels remain. If pumping started at 8 a.m., find the equation relating the number of barrels n at time t (in h) from 8 a.m. When will the tank be empty?
In a research project on cancer, a tumor was determined to weigh 30 mg when first discovered. While being treated, it grew smaller by 2 mg each month. Find the equation relating the weight w of the tumor as a function of the time t in months. Graph the equation.
- The length of a rectangular solar cell is 10 cm more than the width w. Express the perimeter p of the cell as a function of w. What is the meaning of the slope of the line?
A light beam is reflected off the edge of an optic fiber at an angle of . The diameter of the fiber is Find the equation of the reflected beam with the x-axis (at the center of the fiber) and the y-axis as shown in Fig. 21.27.
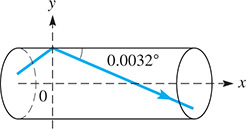
Fig. 21.27
A police report stated that a bullet caromed upward off a floor at an angle of with the floor, as shown in Fig. 21.28. What is the equation of the bullet’s path after impact?
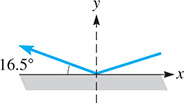
Fig. 21.28
- A survey of the traffic on a particular highway showed that the number of cars passing a particular point each minute varied linearly from 6:30 a.m. to 8:30 a.m. on workday mornings. The study showed that an average of 45 cars passed the point in 1 min at 7 a.m. and that 115 cars passed in 1 min at 8 a.m. If n is the number of cars passing the point in 1 min, and t is the number of minutes after 6:30 a.m., find the equation relating n and t, and graph the equation. From the graph, determine n at 6:30 a.m. and at 8:30 a.m. What is the meaning of the slope of the line?
After taking off, a plane gains altitude at 600 m/min for 5.0 min and then continues to gain altitude at 300 m/min for 15 min. It then continues at a constant altitude. Find the altitude h as a function of time t for the first 20 min, and sketch the graph of
In Exercises 63 and 64, find the equation of the regression line for the given data. Then use this equation to make the indicated estimate. Round decimals in the regression equation to three decimal places. Round estimates to the same accuracy as the given data.
Measurements were taken to record the underwater pressure (in kPa) at various depths (in m). The resulting data is shown in the table. Find the equation of the regression line and then estimate the pressure at a depth of 35 ft. Is this interpolation or extrapolation?
Depth, d (m) 0 10 20 30 40 50 Pressure, p (kPa) 101 201 292 396 500 586 The shear strength of the bond between two propellants is important in rocket engines. The following table shows the age of the propellant t (in days) and the shear strength s (in psi). Find the equation of the regression line and then estimate the shear strength for propellant that is 7 days old. Is this interpolation or extrapolation?
Age of propellant, t (days) 14 56 88 133 150 167 Shear strength, s (psi) 2654 2316 2200 1708 1754 1678
In Exercises 65–68, treat the given nonlinear functions as linear functions in order to sketch their graphs. At times, this can be useful in showing certain values of a function. For example, can be shown as a straight line by graphing y as a function of A table of values for this graph is shown along with the corresponding graph in Fig. 21.29.

Fig. 21.29
| x | 0 | 1 | 2 | 3 | 4 | 5 |
| 0 | 1 | 4 | 9 | 16 | 25 | |
| y | 2 | 5 | 14 | 29 | 50 | 77 |
The number n of memory cells of a certain computer that can be tested in t seconds is given by Sketch n as a function of
The force F (in lb) applied to a lever to balance a certain weight on the opposite side of the fulcrum is given by where d is the distance (in ft) of the force from the fulcrum. Sketch F as a function of 1/d.
A spacecraft is launched such that its altitude h (in km) is given by for Sketch this as a linear function.
The current i (in A) in a certain electric circuit is given by Sketch this as a linear function.