Lesson 51 | Plotting Drawings
In this lesson, you learn how to plot from a layout or model space to paper or to an electronic file. Outputting your drawings is a crucial step in communicating your design ideas to others.
Objectives
After completing this lesson, you will be able to:
- Identify the environments from which you can output data.
- Explain the reason for and characteristics of plotting from model space.
- State the characteristics of plotting from layouts.
- Plot drawings from model space or from a layout.
- Use the Preview command to view what you plot.
About Plotting Environments
You create drawings to store design data and to communicate it to others. The communication occurs when you output the data on paper or to an electronic file. The terms print or plot are used interchangeably to describe the process of outputting the data stored in a drawing file. Design Web Format (DWF) is the most common and versatile electronic file format you can use to output and distribute your drawings.
There are two methods for outputting data. One is to plot from model space and the other is to plot from layouts. Each method has its own list of items to configure and control to achieve the desired output. No matter which method you use, your design data is created in model space and remains at full scale, also referred to as real world size.
Plotting from the drawing Layout or from the drawing Model
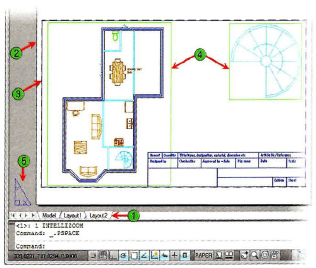
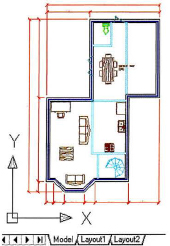
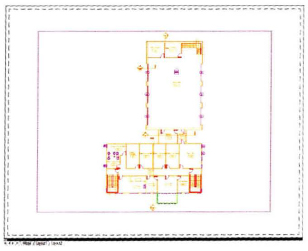
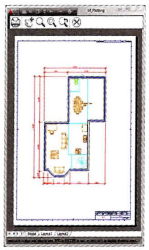
The following illustration shows the drawing Layout. You select a layout tab (1) to activate the drawing layout. The Layout displays the paper (2), the plot area designated by the a dashed line (3), the drawing viewports (4) and the scaled view of the drawings in those viewports. The paperspace icon is visible in the left corner (5).
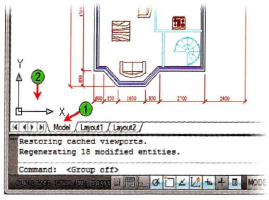
The illustration below shows the drawing model. You select the Model tab (1) to activate model space. This is the environment where you create your drawing. If the UCS icon is on, it is displayed, typically in the left corner (2).
Plot or Publish
When you output data from a single layout in a drawing file, you usually use the Plot command. When you need to output data from multiple layouts within one or more drawings, you can use the Publish command. Publishing gives you the ability to create a list of drawings to plot, select what to plot from multiple files, and save that selected information as a Drawing Set Descriptions (DSD) file. Using a DSD file, you can easily open and plot the data from the drawing list without having to reiterate what and how to plot.
Key Terms
Defined Below are some key terms associated with plotting.
| Term | Description |
| Plot | The act of outputting the active drawing file to a plotter, printer, or file. |
| Model Space | The area of the file where you draw your model at full scale after you decide what one unit in the drawing represents in the real world (millimeters, centimeters, inches, feet, and so on). |
| Layout | An environment used to set up your data for output. You can specify the paper size, add a title block, display multiple views of the drawing at multiple scales, and add notes specific to that plotted sheet. |
| DWF | A highly compressed file that contains the output data for others to view electronically. |
Example of When to Plot
While the design industry is migrating toward a paperless process, we still require design output to paper and compressed image files. You use the Plot command to create this output. As you work on your design, you may need to send a check plot to the laser printer in your work area. You can use this printed output to discuss the design with others or fax it to a colleague to review. You may want to post the same data to your Web site for others to view electronically. In this case, you would plot the file to DWF format for posting to your Web site.
Plotting from Model Space
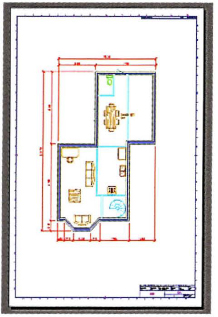
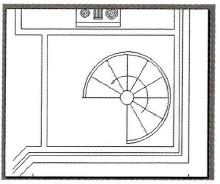
The main reason to plot from model space is to have a paper printout of a specific area of your design so that you can review it. The following image is an example of geometry in model space that can be plotted.
When you plot from model space, all the geometry that resides in the model space environment can be printed. If you want to print a specific part of your drawing, you have to specify the area to plot. If you want to print your drawing at a specific scale, you have to specify the plot scale. If you want to have a border and title block around the geometry in model space, you have to scale it up or down based on the plot scale you are using.
For example, a drawing that will plot at a scale of 1:20 requires a border and title block that are created scaled up 20 times. When you plot your drawing at a scale of 1:20, the border, title block and drawing will be scaled down to fit the paper.
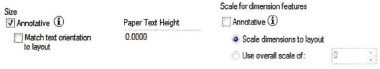
To plot text and dimension objects at a specific size from model space, choose the annotative property for each style and set the Annotative scale for the drawing. The images below show the details of the Text Style and Dimension Style dialog box (Fit tab) where you can choose the Annotative property.
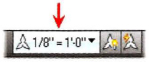
The following image shows where you can access the Annotative Scale list on the status bar.
Plotting Annotations
When you plot from model space, all objects appear with the same relative scale as they appear on screen. Objects that have the annotative property assigned to them display and plot using the annotative scale that is currently set on the status bar. So, for annotative objects, you need to adjust the annotation scale to a value that provides a legible annotation size on screen before plotting your drawing.
If you do not assign the annotative property to objects such as Text Style and Dimension Style, you have to create the text and dimension at a height and fit that are proportionate to the plot scale in order for them to be legible.
Procedure: Plotting from Model Space
The following steps give an overview of plotting a windowed area of your drawing from model space.
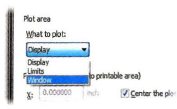
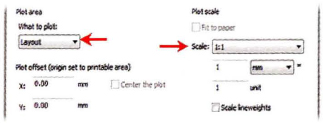
- Start the Plot command. In the Plot dialog box under Plot Area, select Window from the What to Plot list.
- When prompted to specify a window for printing, drag a window around an area to be plotted, as shown.
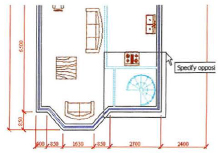
- When prompted to specify a window for printing, drag a window around an area to be plotted, as shown.
- Adjust Paper size, Plot scale, and other parameters as needed in the Plot - Model dialog box. Click Preview to view and plot your selected area.
Guidelines for Plotting from Model Space
- Use the annotative property for text and dimension styles and choose the annotation scale for your plot. Annotations automatically scale themselves in the drawing according to the annotation scale you select.
- When creating a text style using the Annotative property, you can specify the paper text height. This height is multiplied by a scale factor that is determined by the annotation scale.
- You can create different text styles with different text heights and fonts for your annotations; for example, you could create one style for notes and dimensions and another style for titles.
- The most common plot areas you use when plotting from Model space are Extents and Window.
- Use the Center plot option to keep uniform white space around your plotted output.
- The plot area varies according to the printer/plotter selected.
- Choose the Fit to Paper plot scale option to check your drawing when creating a plot from model space.
- If your title block or border is drawn full scale, and your plot scale is not 1:1, you must scale the title block according to the plot scale. For example, if the annotation scale is 1:10 your scale factor is 10. If the annotation scale is & #188;” − 1’0”, your scale factor is 48(4 × 12”).
- You can retain the Plot settings in the Page Setup Manager. Right-click the Model tab to access the Page Setup Manager.
Plotting from Layouts
Use layouts to set up the information you want to output. For each layout, you select the size of paper you want and set the plot scale to 1:1. In the paper layout, one unit represents the paper distance on a plotted sheet and the units are either millimeters or inches.
Since the geometry is not scaled during the plot process, you can add the border and any textual notes on the layout at the desired output size. For example, if drawing notes are supposed to be 1/8” tall, you set the text height to 1/8”.
Another advantage of layouts is that you can create multiple views of model geometry on the same sheet and display them at different scales or create multiple layouts to display different views of the model space geometry. Additionally, one instance of annotative objects, such as text or dimensions, can be displayed at the same size in several views of different scales.
Procedure: Plotting from a Layout
The following steps give an overview of plotting a layout.
- Start the Plot command and verify that the Plot area is set to Layout. Also, verify that your plot scale is set to 1:1. Your paper size was also set while creating the layout so it should not need to be changed.
- Your layout should have a page setup, and the plotter should already be assigned using the Page Setup Manager from the Layout tab. Verify that these settings are as you want them. Click Preview to review your output. If your preview looks correct, right-click, and click Plot. If you need to make a change, right-click, click Exit to return to the plot dialog box and make your changes.
Guidelines for Plotting from a Layout
- Create the design geometry in the model environment at full scale.
- Set the paper size for the layout and a plot scale of 1:1 for the paper using the Page Setup Manager.
- The scale factor of the model geometry on the layout is determined by the scale factor that you set for each viewport.
- For text and dimensions created in model space, you should use Annotative styles. The Annotative styles scale according to the selected viewport scale. Annotations plot at the text size you choose when you set up your Annotative styles.
- You can create multiple viewports to display different sections of the model geometry or show it at different scales.
- On a layout with multiple viewports, you can freeze layers in selected viewports independently to create different displays of the same geometry.
- Insert the border and title block on the layout at full scale.
- When plotting from the Layout, make sure the Paper space is active and not the Model in the viewport.
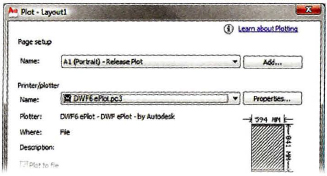
Plot Command
The Plot command prints data from the active drawing to a plotter, printer, or file using the settings in the Plot dialog box.
Command Access

Plot Dialog Box
Click the Expand button at the bottom-right of the Plot dialog box to access more options.
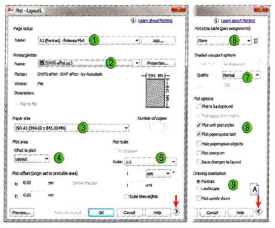
Warning!
The Plot Options shown in area 8 are not all available in AutoCAD LT®.

Plotter Configurations
All of the settings you specify in the Plot dialog box can be saved and imported to use with other drawings or on different workstations. A saved plot configuration is a PC3 file. Earlier versions of AutoCAD® plotter configurations are PCP or PC2 files. Click Properties (1) in the Plot dialog box to access the Plot Configuration Editor to access the Save (2) and Import (3) options.

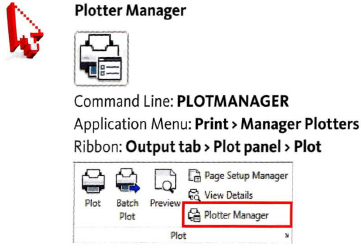
You can also add or edit a plotter configuration using the Plotter Manager.
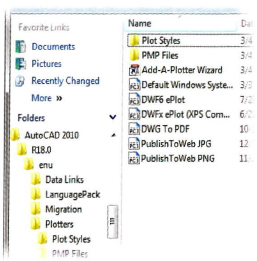
Command Access
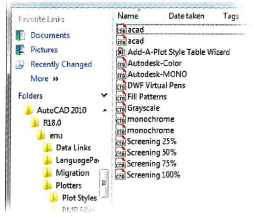
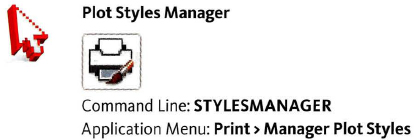
The Plot Style Manager command opens the folder of existing plot styles where you can choose a plot style to edit or add a new plot style.
Command Access
Guidelines for the Plot Command
- Plot and Print are the same command. There is not a separate Print command. To print a drawing, use the Plot command.
- Plot settings can be saved in the Page Setup Manager for the Model tab or for each Layout.
- You can override the settings in the Page Setup Manager from the Plot dialog box.
- You can save a Plot setup from the Plot dialog box by clicking Add and naming the page setup. Named plot setups appear in the list for later reuse.
- To save changes to a plot setup, click Add and enter the original name for the new page setup. This redefines the previously named setup.
- You must select a printer or plotter in order to Preview the plot settings.
- You can use CTRL+P to initiate the Plot dialog box.
- You can save a plotter configuration and import it into another drawing. A saved plot configuration is a PC3 file. Earlier versions of AutoCAD plotter configurations are PCP or PC2 files. Click Properties in the Plot dialog box to access the Save and Import options.
- Save Plotter configurations and Plot Style Tables for later reuse when plotting your drawings or when using other computer workstations to plot your drawings.
- If you do not specify a plot style table, the drawing plots according to the default printer settings.
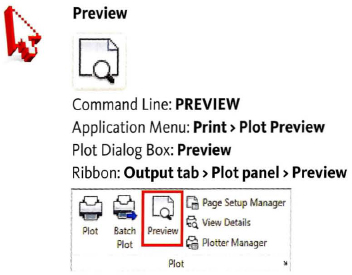
Preview Command
Previewing gives you an opportunity to review a full-page version of how the final plot will appear on the printed sheet or in the electronic file. Within the Preview window, you can pan and zoom the display to assist you in your review. You can click the Plot button to directly plot what is displayed, or you can close the Preview window. If you initiated the preview from within the Plot dialog box, closing the Preview window returns you to the Plot dialog box.
Command Access
Preview Command Guidelines
- Preview enables you to view your drawing before plotting it, which is a good idea.
- Start the preview from the Plot dialog box or by using the Plot Preview button on the Plot panel.
- You can plot from the Preview window, without returning to the Plot dialog box.
- Closing the Preview window does not close the drawing.
- If there is no plotter assigned to the layout, you cannot preview the drawing.