
The Front-End Pipeline Stages
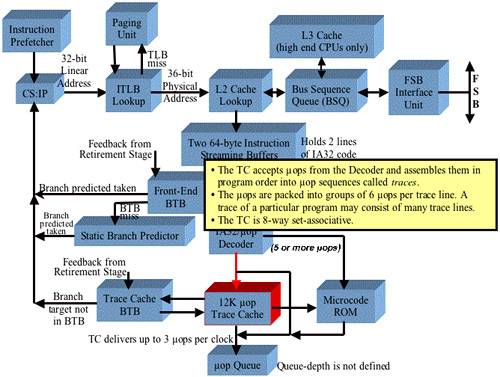
Refer to Figure 38-4 on page 904. These are the stages that fetch legacy IA32 instructions from memory, decodes them into μops, caches them in the Trace Cache, queues them up, and feeds them to the μop pipeline (pictured in Figure 38-3 and Figure 38-1). As noted in Figure 38-2, the L1 Data Cache is not shown because the emphasis in this discussion is on the fetching, decoding and execution of instructions. A detailed description of the L1 Data Cache can be found in “The Pentium® 4 Caches” on page 1009.

The sections that follow describe the various elements shown in the figure.
CS:EIP Address Generation
Refer to Figure 38-4 on page 904. The Instruction Prefetcher is tasked with prefetching the IA32 instructions that comprise the currently-executing program from memory before they are actually needed. Unless told otherwise by the processor's Branch Prediction logic, the Prefetcher fetches instructions from memory in a sequential manner. It uses the current contents of the CS:EIP register pair to determine where to fetch the next instructions from in memory. If the Branch Prediction logic predicts that a branch will be taken, the Branch Prediction logic forwards the branch target address to the Prefetcher and the new address is placed in the CS:EIP register pair. The prefetcher then resumes normal operation, using CS:EIP to form the address from which instructions are fetched.
The Prefetcher reads instructions 32 bytes at a time starting at the target address specified in the CS:EIP register pair and forwards the 32 byte block of IA32 code into the Instruction Streaming Buffer.
Memory address formation was covered earlier:
Memory address formation in Real Mode was covered in “Memory Addressing” on page 71.
Memory address formation in Protected Mode was covered in “Intro to Segmentation in Protected Mode” on page 109.
On an instruction fetch, the processor forms the 32-bit linear memory address by adding the offset from the EIP register to the segment base address from either:
the CS register (in Real Mode), or
the cached Code Segment descriptor (in Protected Mode).
The 32-bit linear memory address is then forwarded to either:
the Paging Unit if the processor is in Protected Mode with Paging enabled;
or directly to the L2 Cache if the processor is in Real Mode or SM Mode.
Linear to Physical Address Translation
Refer to Figure 38-5 on page 906. Assuming that the processor is in Protected Mode and that paging is enabled, the 32-bit linear address is submitted to the ITLB (Instruction TLB) for a lookup:
If the target Page Directory Entry (PDE; if it's a large page), or Page Table Entry (PTE; if it's a 4KB page) is in the ITLB, it is used to translate the 32-bit linear address into a 36-bit physical memory address.
If the lookup results in a miss, the Paging Unit performs a lookup in the currently-executing program's Page Directory and, if the target is 4KB page, in the selected Page Table:
- Assuming that the Present bit in the selected PDE or PTE is set to one, the PDE or PTE is cached in the ITLB and is used to translate the 32-bit linear address into a 36-bit physical memory address.
- If the Present bit in the selected PDE or PTE is cleared to zero, the target page is not present in memory. As a result, the processor experiences a Page Fault exception.
Figure 38-5. The Paging Unit Translates the Linear Address to a 36-bit Physical Address

A complete description of Paging can be found in the following sections:
“386 Demand Mode Paging” on page 209 describes the baseline paging capability.
“Paging-Related Changes” on page 449 describes the paging enhancements made in the 486 processor.
“4MB Pages” on page 501 describes the paging enhancements made in the Pentium® processor.
“Paging Enhancements” on page 554 describes the paging enhancements made in the Pentium® Pro processor.
“PSE-36 Mode” on page 731 describes the paging enhancements made in the Pentium® II Xeon processor.
“PAT Feature (Page Attribute Table)” on page 797 describes the paging enhancements made in the Pentium® III Xeon processor.
In the Pentium® 4 processor the ITLB and DTLB (Data TLB) have the following characteristics:
The TLB for all page sizes has 128 entries and is a 4-way set associative cache.
A single DTLB is used for 4KB PTEs and for large page PDEs. It has 64 entries and is fully associative cache.
The L2 Cache Lookup
Refer to Figure 38-6 on page 907. After the 32-bit linear address has been translated into a 36-bit physical memory address by the Paging Unit, it is submitted to the on-die L2 Cache for a lookup. The L2 Cache caches legacy IA32 instructions as well as data (it is a unified code/data cache). Its cache line size is 128 bytes and each line is divided into two sectors of 64 bytes each, each with its own state bits (indicating whether the sector is in the M, E, S or I state). A complete description of the L2 Cache can be found in “The L2 ATC” on page 1025.
If the lookup results in a hit, the line is forwarded downstream into the Instruction Streaming Buffer (and the description continues at “The Code Block Is Placed in the Instruction Streaming Buffer” on page 909).
If the lookup results in a miss, the request is forwarded upstream to the Bus Sequence Queue (BSQ) logic.

On an L2 Miss, the Request Is Passed to the BSQ
Refer to Figure 38-7 on page 908. On an L2 Cache miss, the request is forwarded upstream to the Bus Sequence Queue (BSQ) logic. The BSQ takes one of the following actions:
If the processor implements an on-die L3 Cache (e.g., the Pentium® 4 Extreme Edition or the Pentium® Xeon MP), the request is forwarded upstream to the L3 Cache for a lookup:
- If the L3 lookup results in a cache hit, the requested sector is forwarded downstream and is placed in the L2 Cache and in the Instruction Streaming Buffer and the discussion continues at “The Code Block Is Placed in the Instruction Streaming Buffer” on page 909. The L3's cache line size is 128 bytes and each line is divided into two sectors of 64 bytes each, each with its own state bits (indicating whether the sector is in the M, E, S or I state). A complete description of the L3 Cache can be found in “The L3 Cache” on page 1041.
- If the L3 lookup result in a miss, the BSQ forwards the request upstream to the FSB Interface Unit for fulfillment from memory.
If the processor doesn't implement an on-die L3 Cache, the request is forwarded upstream to the FSB Interface Unit to be fulfilled from memory.
Figure 38-7. On an L2 Cache Miss, the Request Is Forwarded to the Bus Sequence Queue

If the request has missed the L2 and L3 caches, the BSQ forwards it upstream to the FSB Interface Unit for fulfillment from memory. The FSB Interface Unit arbitrates for ownership of the Request Phase signal group to fetch the requested code line from memory. When the line is returned from memory, it is placed in the L3, the L2 and in the Instruction Streaming Buffer. This discussion continues in the next section.
As a note of interest, the BSQ also handles accesses to the Local APIC's register set.
The Code Block Is Placed in the Instruction Streaming Buffer
Refer to Figure 38-8 on page 909. When the line has been obtained from the L2, the L3 or from system memory, it is placed in the instruction streaming buffer. The data path between the L2 cache and the buffer is 256 bits (32 bytes) wide.

The Front-End BTB
Refer to Figure 38-9 on page 911. If any of the instructions in the Instruction Streaming Buffer are conditional branches, they are submitted to the Front-End Branch Target Buffer (BTB) for a lookup (using the linear address of the branch). The BTB is a high-speed, look-aside cache that maintains history on conditional branch instructions it has seen executed in the past. It consists of two elements:
The Branch History Table. This is the cache directory where the linear address of the branch being tracked is stored, along with historical execution data for the branch.
The Branch Target Buffer. This is the cache itself. Each entry is associated with a directory entry in the Branch History Table and the cache entry contains the memory address that the branch is predicted to branch to.

It can track the history of up to 4096 branches. Whenever a conditional branch is executed (much further down in the μop pipeline), the execution unit provides feedback to the BTB regarding whether the branch was taken or not so it can update the execution history of that branch.
When a conditional branch is submitted to the Front-End BTB, it uses the linear memory address that the instruction was fetched from to perform the lookup:
A miss indicates that the BTB does not have any history on that branch. In this case, the BTB will not alter the path from which the Prefetcher is fetching. It forwards the branch to the Static Branch Predictor so it can make a prediction based on its hardwired algorithm. The discussion continues at “The Static Branch Predictor” on page 911.
A hit indicates that the BTB has seen the branch before and has some execution history to base a prediction upon:
- If it predicts the branch as not taken, the BTB will not alter the path that the Prefetcher is fetching from.
- If it predicts the branch taken, however, the BTB forwards the branch target address to the Prefetcher and commands it to start fetching instructions from the newly-predicted path. In addition, the instructions behind the branch in the pipeline are flushed.
The next section describes the Static Branch Predictor.
The Static Branch Predictor
Refer to Figure 38-10 on page 912. The Static Branch Predictor is sometimes referred to as the Backstop Predictor because it provides a backup to the dynamic branch prediction logic (i.e., the BTB). A conditional branch is submitted to the Static Branch Prediction logic in the event of a miss on the Front-End BTB. The Static Branch Prediction decision tree is illustrated in Figure 38-11 on page 913.
Figure 38-10. The Static Branch Predictor

Figure 38-11. The Static Branch Prediction Algorithm

For the most part, the static branch predictor handles branches that miss the BTB. However, in the case of an unconditional IP-relative branch (see the top left portion of Figure 38-11 on page 913), the Static Branch Predictor always forces the prediction to the taken state.
The Travels of a Conditional Branch Instruction
To put branch prediction into perspective, there is value in tracing a conditional branch instruction as it passes through the core on its way to its first execution, as well as when it is executed on subsequent iterations:
When the conditional branch is presented to the Front-End BTB on its first voyage through the core, it results in a BTB miss.
The conditional branch is decoded into a μop and is placed in the Trace Cache. It should be noted, however, that each line in the Trace Cache consists of six μops and the front-end logic builds an entire trace line and then inserts it in the Trace Cache. μops are not written into the Trace Cache one at a time.
Eventually, the conditional branch is forwarded into the μop queue.
The conditional branch is presented to the Trace Cache BTB which has a miss.
The conditional branch continues on into the instruction pipeline and is executed.
A record of the conditional branch's execution (i.e., whether it was taken or not) is recorded in the Front-End BTB and in the Trace Cache BTB.
The next time that the conditional branch is requested from the Trace Cache, it is once again presented to the Trace Cache BTB, resulting in a hit this time.
Based on the history in the Trace Cache BTB, the BTB makes a prediction as to whether or not the conditional branch will be taken when it is executed.
When the conditional branch is executed again, its execution history is updated in both BTBs (i.e., the BTBs become smarter).
The Trace Cache can only track the history of up to 512 conditional branches that have been fed into the pipeline from the Trace Cache, while the Front-End BTB can track the history of 4096 conditional branches that have passed its way. The Front-End BTB contains a superset of the branch history that is in the Trace Cache BTB.
As time goes on, both BTBs must eventually evict the history of a branch to make room to record the history of a more recent branch. The decision as to which entry to evict is made based on the BTB's LRU (Least-Recently Used) algorithm (which is undocumented).
The IA32 Instruction Decoder
The P6 Instruction Decoder Was Complex
The P6 implemented an array of three decoders that decoded the next three IA32 instructions in strict program order and forwarded the resulting μops into the μop queue. Between one and three IA instructions were submitted to decoders 0 through 2 for translation into μops. The complex decoder (decoder 0) could decode any IA instruction that was not greater than seven bytes in length and that translated into no more than four μops. The simple decoders (decoders 1 and 2) could decode any IA instruction that was not greater than seven bytes in length and that translated into a single μop. This array of decoders required quite a bit of silicon.
To achieve the greatest possible throughput in the decode stage, a compiler had to generate instruction sequences with this decoder template in mind.
While the complex array of multiple decoders served the P6 processors well, it could not easily be implemented in the substantially faster Pentium® 4 processor in a manner that wouldn't result in starving the very fast execution engine.
The Pentium® 4 Decoder Is Simple
Refer to Figure 38-12 on page 915. In the Pentium® 4 processor core, there is only one decoder and it translates one IA instruction per clock cycle (as long the instruction decodes into no more than four μops). Any instruction that decodes into more than four μops is routed to the Microcode Store ROM (MS ROM) for decode (see “Complex Instructions Are Decoded by the Microcode Store ROM” on page 917).

The Trace Cache Can Keep Up with the Fast Execution Engine
The IA32 instructions that comprise a program are decoded into μops that are placed in the Trace Cache (TC), six μops per Trace Cache line. Any subsequent execution of the same code results in a hit on the Trace Cache and the μops are streamed into the pipeline again, bypassing the decode stage. When an IA32 instruction is a branch and it is predicted taken, the resultant branch μop stored in the TC is immediately following by the μop(s) that represent the IA32 instruction that resides at the branch target address.
μops Are Streamed into the Trace Cache and the μop Queue
Refer to Figure 38-13 on page 916. The μops produced by the instruction decoder are stored in the Trace Cache (which is the L1 Code Cache) and, if they are the next instructions that must be fed into the pipeline, into the μop Queue that feeds the pipeline.

Complex Instructions Are Decoded by the Microcode Store ROM
General
Refer to Figure 38-14 on page 918. Any IA32 instruction that decodes into more than four μops is routed to the Microcode Store ROM for decode. The ROM performs a lookup and starts streaming out the μops that equate to the single IA32 instruction. The μops are streamed into the μop Queue that feeds the instruction pipeline.

Some very complex IA32 instructions can decode into hundreds if not thousands of μops. An example would be a string move instruction with a repeat prefix (REP) preceding it. To execute a string move instruction, the core must perform the following repetitive operations:
A memory read (a load) from the source memory buffer address specified in the ESI register into a temporary processor holding register.
A memory write (a store) from the temporary processor holding register to the destination memory address specified in the EDI register.
A decrement of the ECX register to decrement the count of the number of objects moved.
A test to see if the count in the ECX register has been exhausted and a re-execution of the string instruction if the count has not been exhausted. Otherwise, the processor falls through to the next instruction.
Although the Intel® documentation doesn't say so, it is the author's opinion that those μops are not stored in the Trace Cache. The μops produced by one complex IA32 instruction could fill a large portion of the Trace Cache (and that wouldn't be very efficient use of a very valuable resource). Refer to Figure 38-15 on page 919. Rather, a token (consisting of a microcode instruction pointer) representing the complex instruction is placed in the Trace Cache. Whenever it has to be executed, it is sent to the ROM which then streams the resultant μops into the μop Queue.
Figure 38-15. Complex Instructions and the Trace Cache

The MS ROM and Interrupts or Exceptions
When an interrupt or an exception occurs, it is forwarded to the MS ROM and the MS ROM starts streaming μops into the pipeline which, when executed, cause the processor to take the actions necessary to service the interrupt or exception.
The Trace Cache
General
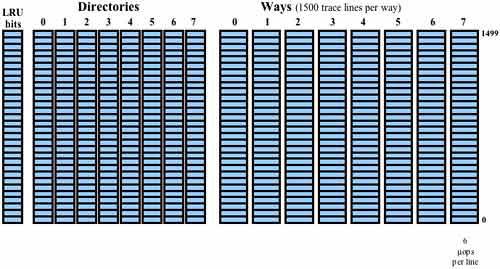
The Trace Cache (TC) takes the place of the L1 Code Cache and can hold up to 12K μops. It is an 8-way set-associative cache that stores lines consisting of six μops each (see Figure 38-18 on page 922). The TC uses the 32-bit linear memory address to perform a cache lookup. When the TC experiences a miss and a new trace line needs to be read into the TC from L2 Cache, the TC consults the LRU bit field associated with the set of eight directory entries to determine in which of the entries the new line will be recorded.
The TC is one element of the entity referred to as the TDE (Trace and Delivery Engine) which is comprised of the TC, the MS ROM, the trace line build logic, and the branch prediction logic that feeds the TC and also reads from the TC.
Refer to Figure 38-16 on page 921 and Figure 38-17 on page 922. Once the TC fills up, the pipeline is supplied with μops directly from the TC most of the time, rather than from the L2 Cache. The L2 Cache is only accessed when the next instruction to be executed is not in the TC. No time is wasted decoding instructions that were decoded earlier and are being re-executed.

A TC miss occurs about as often as previous processors missed their L1 Code Caches. Intel® estimates that the TC has a similar hit rate to an 8KB to 16KB conventional code cache.
In an ordinary L1 Code Cache, a branch instruction may be found anywhere within a cache line and the instruction to which it branches may be anywhere in memory (inside or outside of that line). If the branch jumps to a location outside of the line in which it resides, the instructions in the remainder of the L1 code line (and perhaps additional lines in the code cache) may never be executed and are a waste of valuable cache real estate.
In partnership with the Front-End BTB and the TC BTB, the TC solves this problem. Due to the actions taken by the upstream BTB, the branch instruction is immediately followed by the instruction to which it is predicted to branch. Instructions that are predicted to be branched around are not stored in the TC.
The trace lines stored in the TC consist of the μops that the currently-executing program is predicted to actually execute. The target instruction of a branch is stored in the same trace line as the branch itself even if the branch and the instruction to which it branches reside in widely-separate areas of memory.
Build Mode
When there is a miss on the TC, it enters Build Mode. This means that the request is forwarded upstream to the L2 cache (or higher memory) for fulfillment. The L2 Cache then feeds the requested IA32 code into the Instruction Streaming Buffer. The buffer then feeds the IA32 instructions to the Decoder one at a time, the Decoder streams out the μops from which a TC line is built (hence the term “Build Mode”) and the trace line is stored in the TC. Each Trace Line consists of six μops.
Deliver Mode
When there is a hit on the TC, it enters Deliver Mode and streams the requested μops into the instruction pipeline.
Self-Modifying Code (SMC)
Introduction
Normally the instructions that comprise a program are executed as they were originally written by the programmer. Sometimes, however, the programmer chooses to execute an instruction or series of instructions as originally composed, but then later modifies the instruction(s) on the fly so that when executed the next time, the code executes in its modified form and has a different effect. This is accomplished by reading an instruction into the processor's register set, modifying it, and then writing it back to memory. The next time the Prefetcher fetches the modified instruction(s), they execute in their modified form and have the desired (i.e., altered) effect.
Generally speaking, self-modifying code is considered evil. Processor designers have to support it because people write it, but they usually don't optimize its performance—quite the opposite—you usually take quite a performance hit when it's executed.
Your Code May Appear to be SMC
Even though you may not write self-modifying code, the scenario described in the previous section can still occur, resulting in terrible performance for your program. Consider the case where you place some data in memory immediately following a program. The instructions at the end of your program and the data may reside within the same area of memory. When you read any of these data items into a register, the entire line, which may be comprised of both code and data, is read into the data cache. If you change the data in the register and then store it back to memory, the store results in a hit on the L1 Data Cache and in the Trace Cache. The processor thinks that you are modifying code with the intention of re-executing it in its modified form.
SMC and the Earlier IA32 Processors
When an earlier IA32 processor detected what appeared to be SMC, it was forced to flush its instruction pipeline, had to invalidate the line in all of its caches, to write the modified line back to system memory, and then read the modified back into the processor (see “Self-Modifying Code and the P6” on page 281 of the CD for a description of the process as implemented in the P6 processors). Obviously, this resulted in very poor performance.
SMC and The Pentium® 4
Refer to Figure 38-19 on page 925. The Pentium® 4 processor assumes an SMC condition when any of the following are detected:
When a store is performed, the processor naturally performs a lookup in the L1 Data Cache. If a store is performed and it results in a Data Cache hit, the processor also performs a lookup in the Trace Cache. If the Trace Cache contains any instructions from the same 1K memory area, this triggers an SMC condition.
If the processor reads code from the same 2KB-aligned area of memory that the executing program is currently writing to, this triggers an SMC condition.
One processor may fetch code from a page of memory and another processor may update (i.e., store into) data items that reside within that same page. When the second processor initiates a store to that page (and assuming the page is designated as WB memory) and the store misses its caches, it initiates a Memory Read and Invalidate transaction on the FSB. This is snooped in the first processor's caches (including its Trace Cache). If it results in a hit on the Trace Cache, this triggers an SMC condition.

When an SMC condition is triggered, the processor clears the entire pipeline and the entire Trace Cache as well. This causes massive performance degradation.
The Trace Cache BTB and the Return Stack Buffer
The Trace Cache BTB
Refer to Figure 38-20 on page 927. The Trace Cache BTB is a high-speed, look-aside cache that maintains history on conditional branch instructions it has seen executed in the past. It can track the history of 512 conditional branches. Whenever a conditional branch is executed (much further downstream in the μop pipeline), the execution unit provides feedback to the BTB regarding whether the branch was taken or not.

Refer to “The Travels of a Conditional Branch Instruction” on page 913.
The Return Stack Buffer (RSB)
The programmer calls a subroutine by executing a CALL instruction, explicitly citing the address to jump to. In other words, a CALL instruction is an unconditional branch. When the decoder decodes it the first time and recognizes that it's an unconditional branch, an entry is created in the BTB predicting it as taken.
When the CALL is executed, the address of the instruction that immediately follows the CALL is automatically pushed onto the stack by the processor. The programmer always ends the called routine with a return (RET) instruction. The return instruction pops the previously-pushed address from the stack and jumps to the instruction it points to in order to resume execution of the procedure that called the routine. In other words, the return instruction is also an unconditional branch and can always be predicted as taken. While this is true, it doesn't address the question of where it will branch to.
Prior to the advent of the P6 processor family, the processor kept no record of the address pushed onto the stack and therefore, although it could be predicted that the return is taken, it could not “remember” where the branch would be taken to.
Refer to Figure 38-20 on page 927. When a CALL instruction is executed, the return address is pushed into stack memory and is also pushed onto the RSB. The next RET instruction entering the pipeline causes the processor to access the top (i.e., most-recent) entry in the RSB. The branch prediction logic predicts a branch to the return address recorded in the selected RSB entry. In the event that the called routine alters the return address entry in stack memory, this will result in a misprediction. It is therefore recommended that programmers resist the urge to alter the return address that was automatically saved on the stack when the CALL was executed.
While the P6 RSB had eight entries, the RSB's depth was increased to 12 in the Pentium® 4 processor.
The μop Queue
Refer to Figure 38-21 on page 928. The Trace Cache can post three μops in the μop Queue per clock cycle and the queue can issue three μops per clock cycle to into the first stage of the instruction pipeline (i.e., the Allocator stage).
